Hamal Monitoring App
A live floor plan of every device in an ops room, grown from a single ops room into a monitoring app for many sites.
01 / What an ops room needs to know
An operations room (in Hebrew, a hamal) runs on many devices: computers on several separate networks, phones, printers, fax machines and video-conference endpoints. When one of them fails, the IT support staff need to know at once which device it is, where it stands in the room and how it is connected.
Before this app, those details lived in spreadsheets, and nothing showed at a glance what was down or where to find it.
- No live view of which device is down
- Device details scattered across spreadsheets
- Several separate networks in one room
- Many rooms, bases and regions to cover
02 / What I built
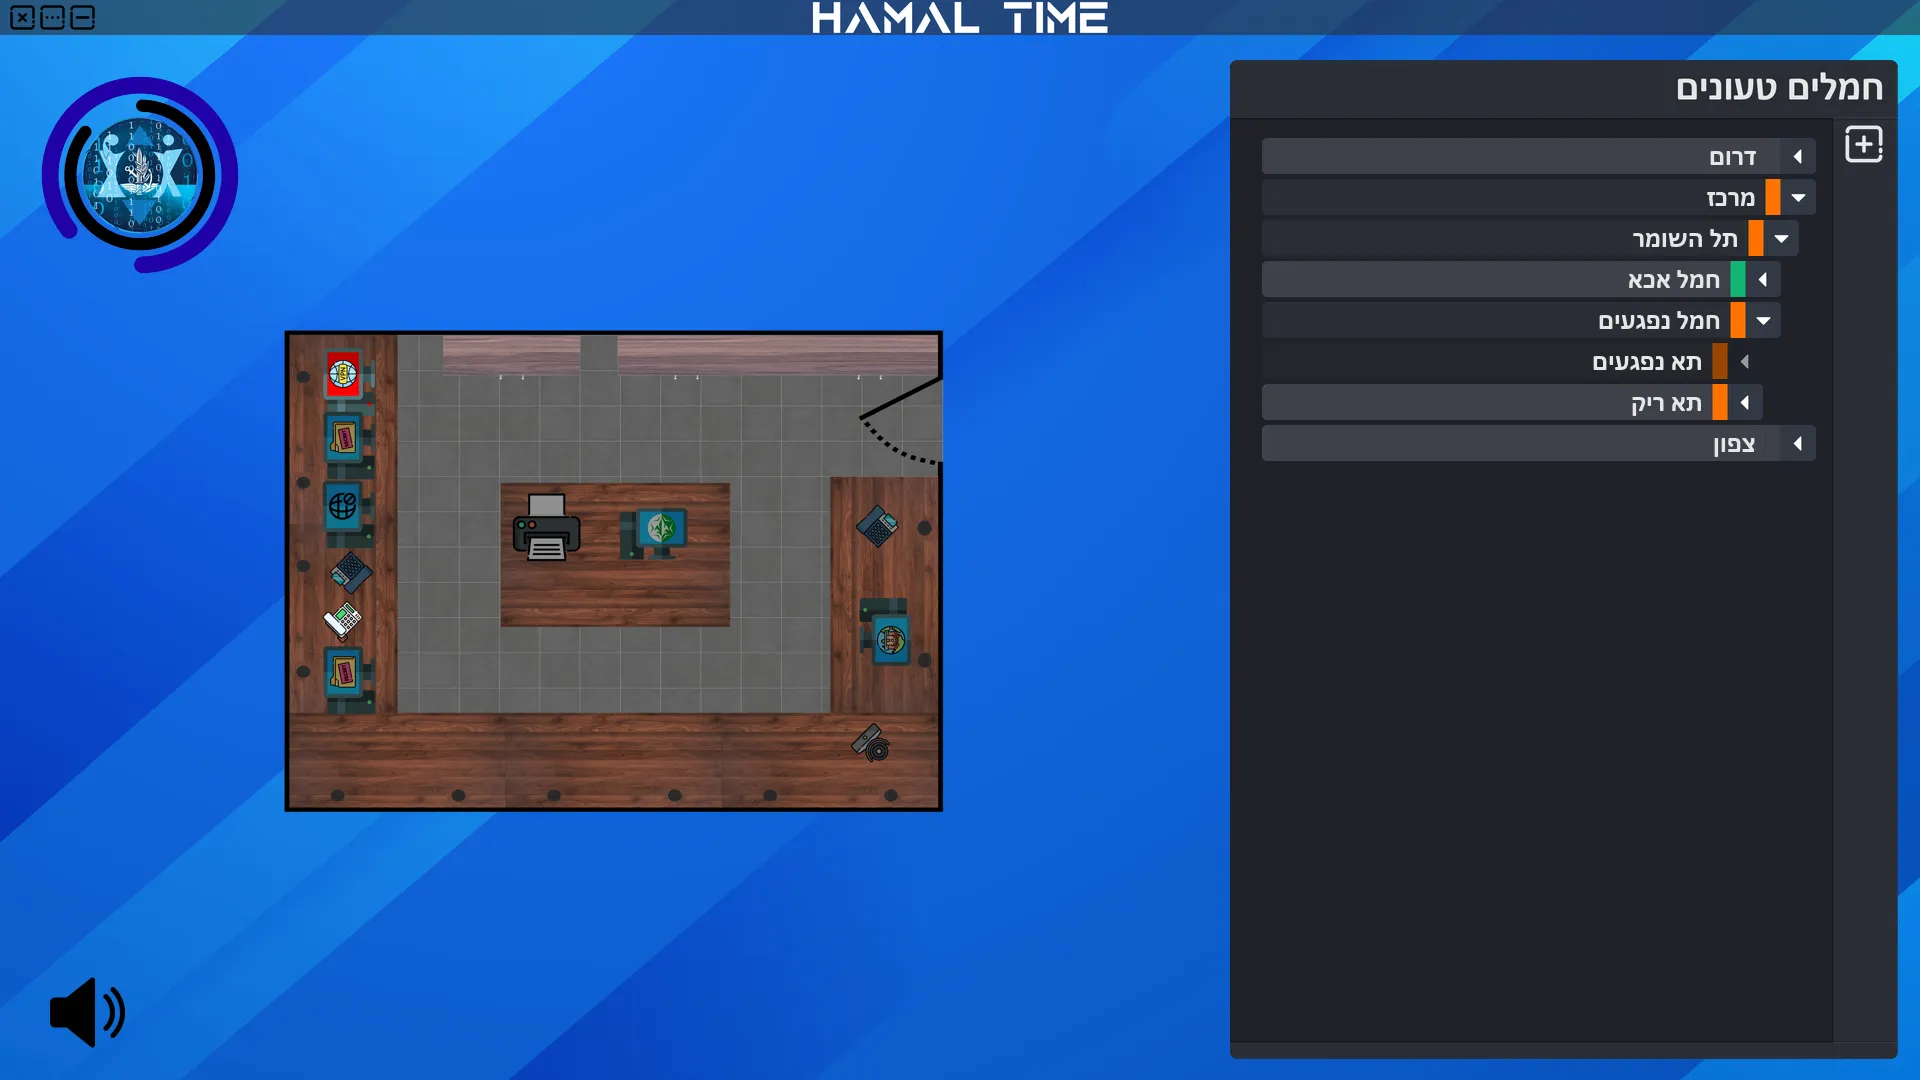
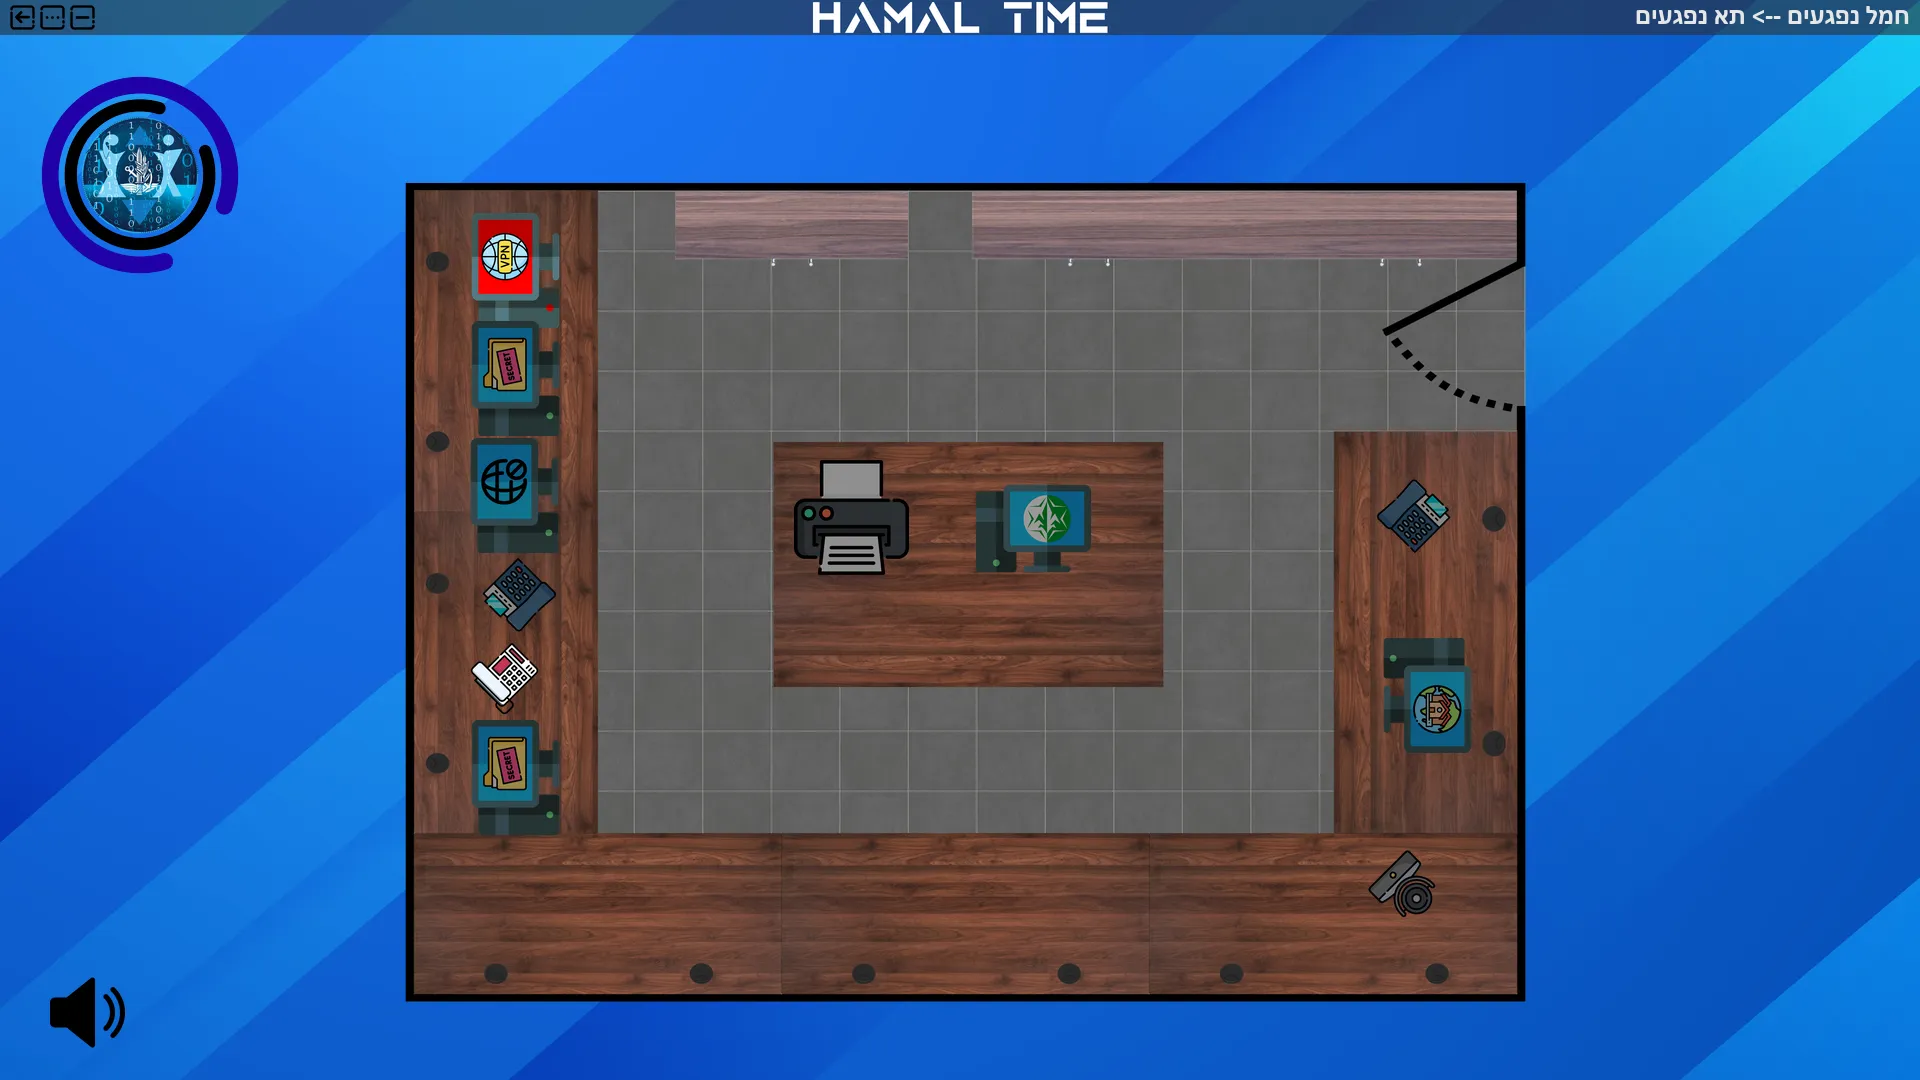
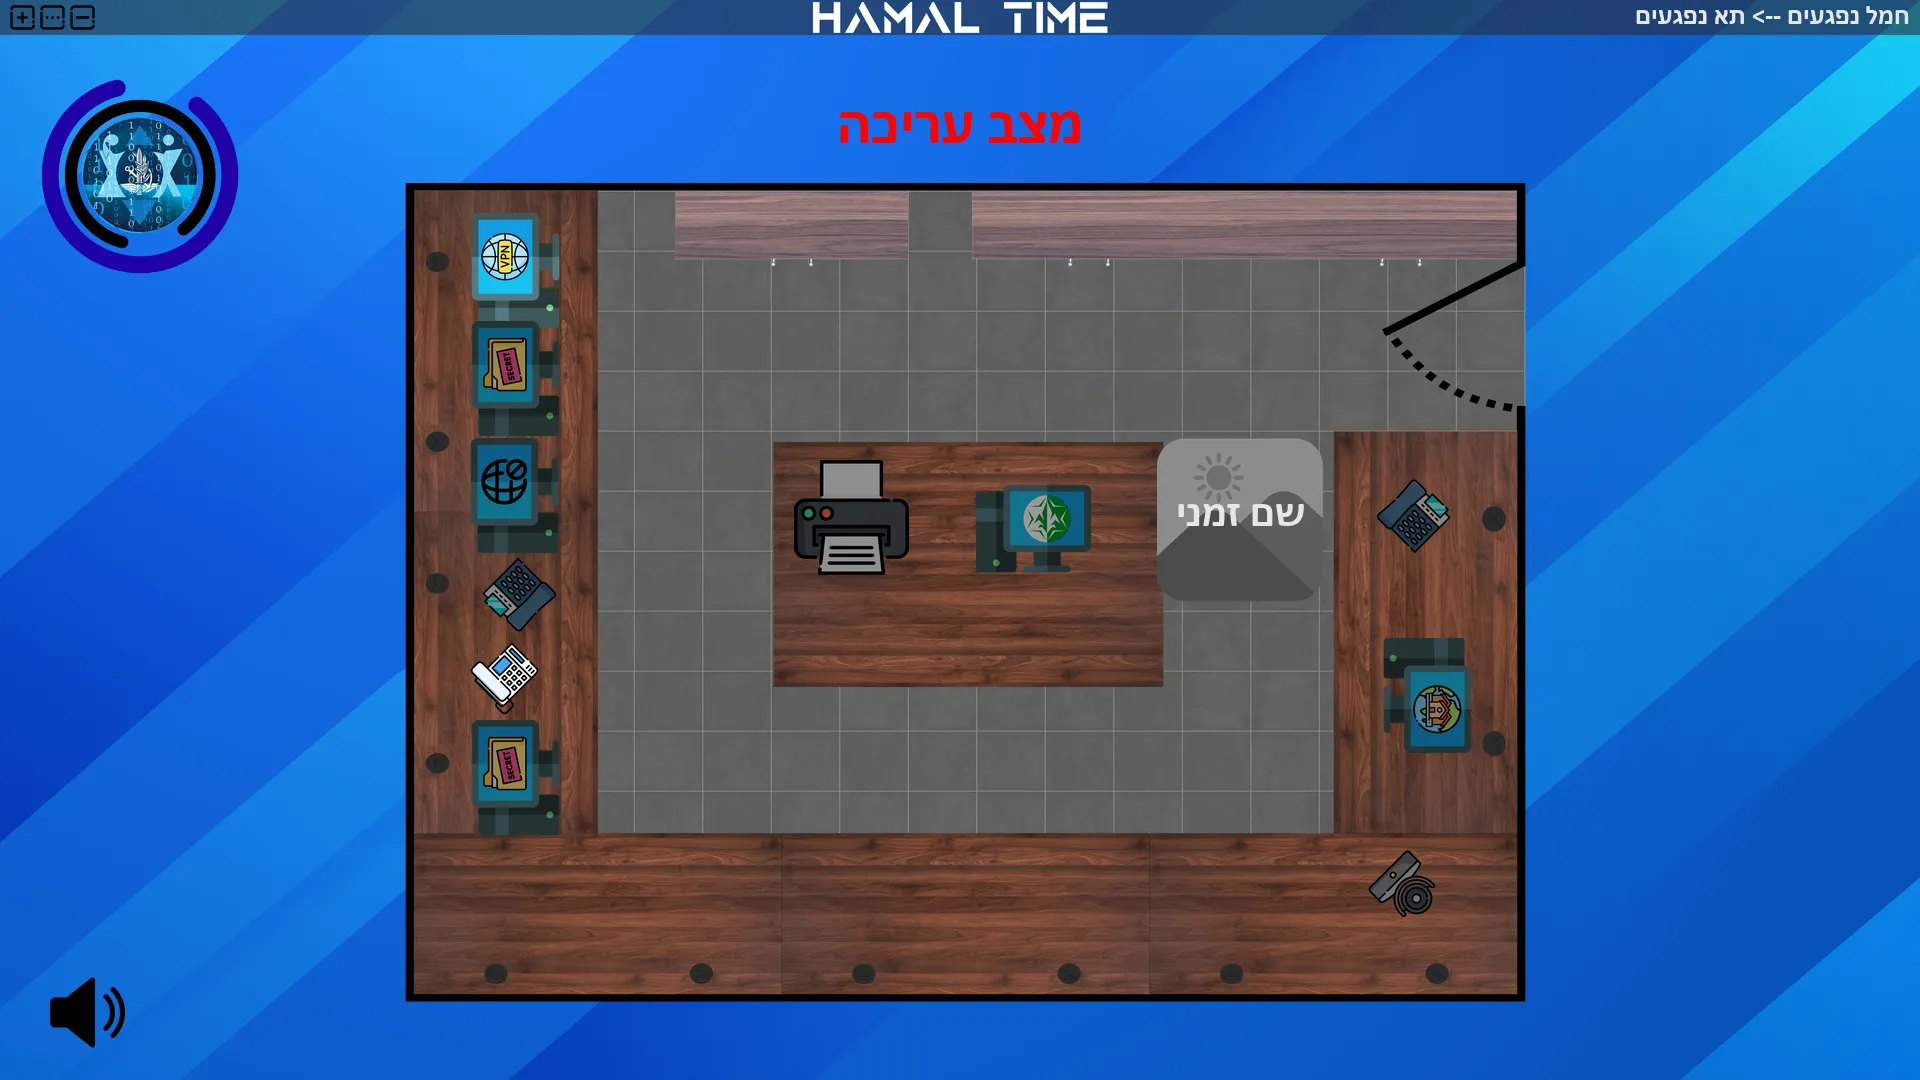
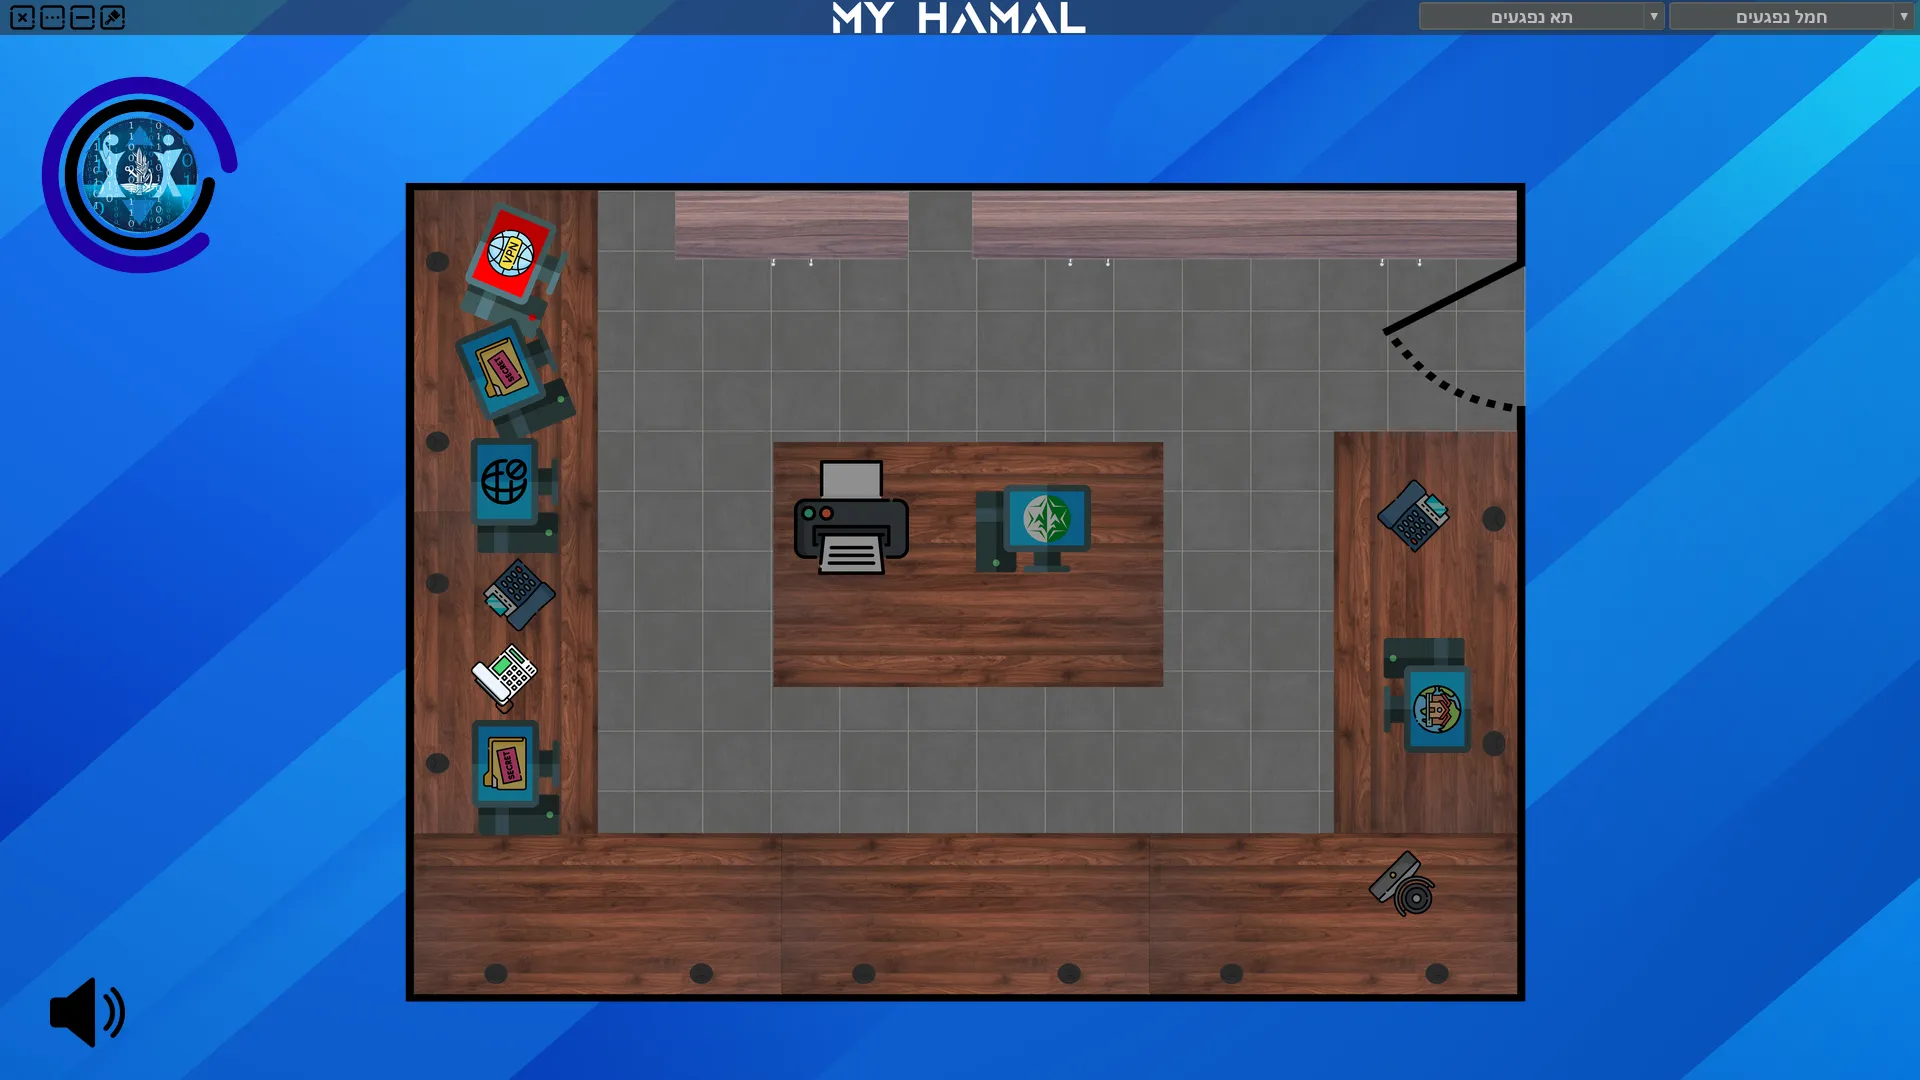
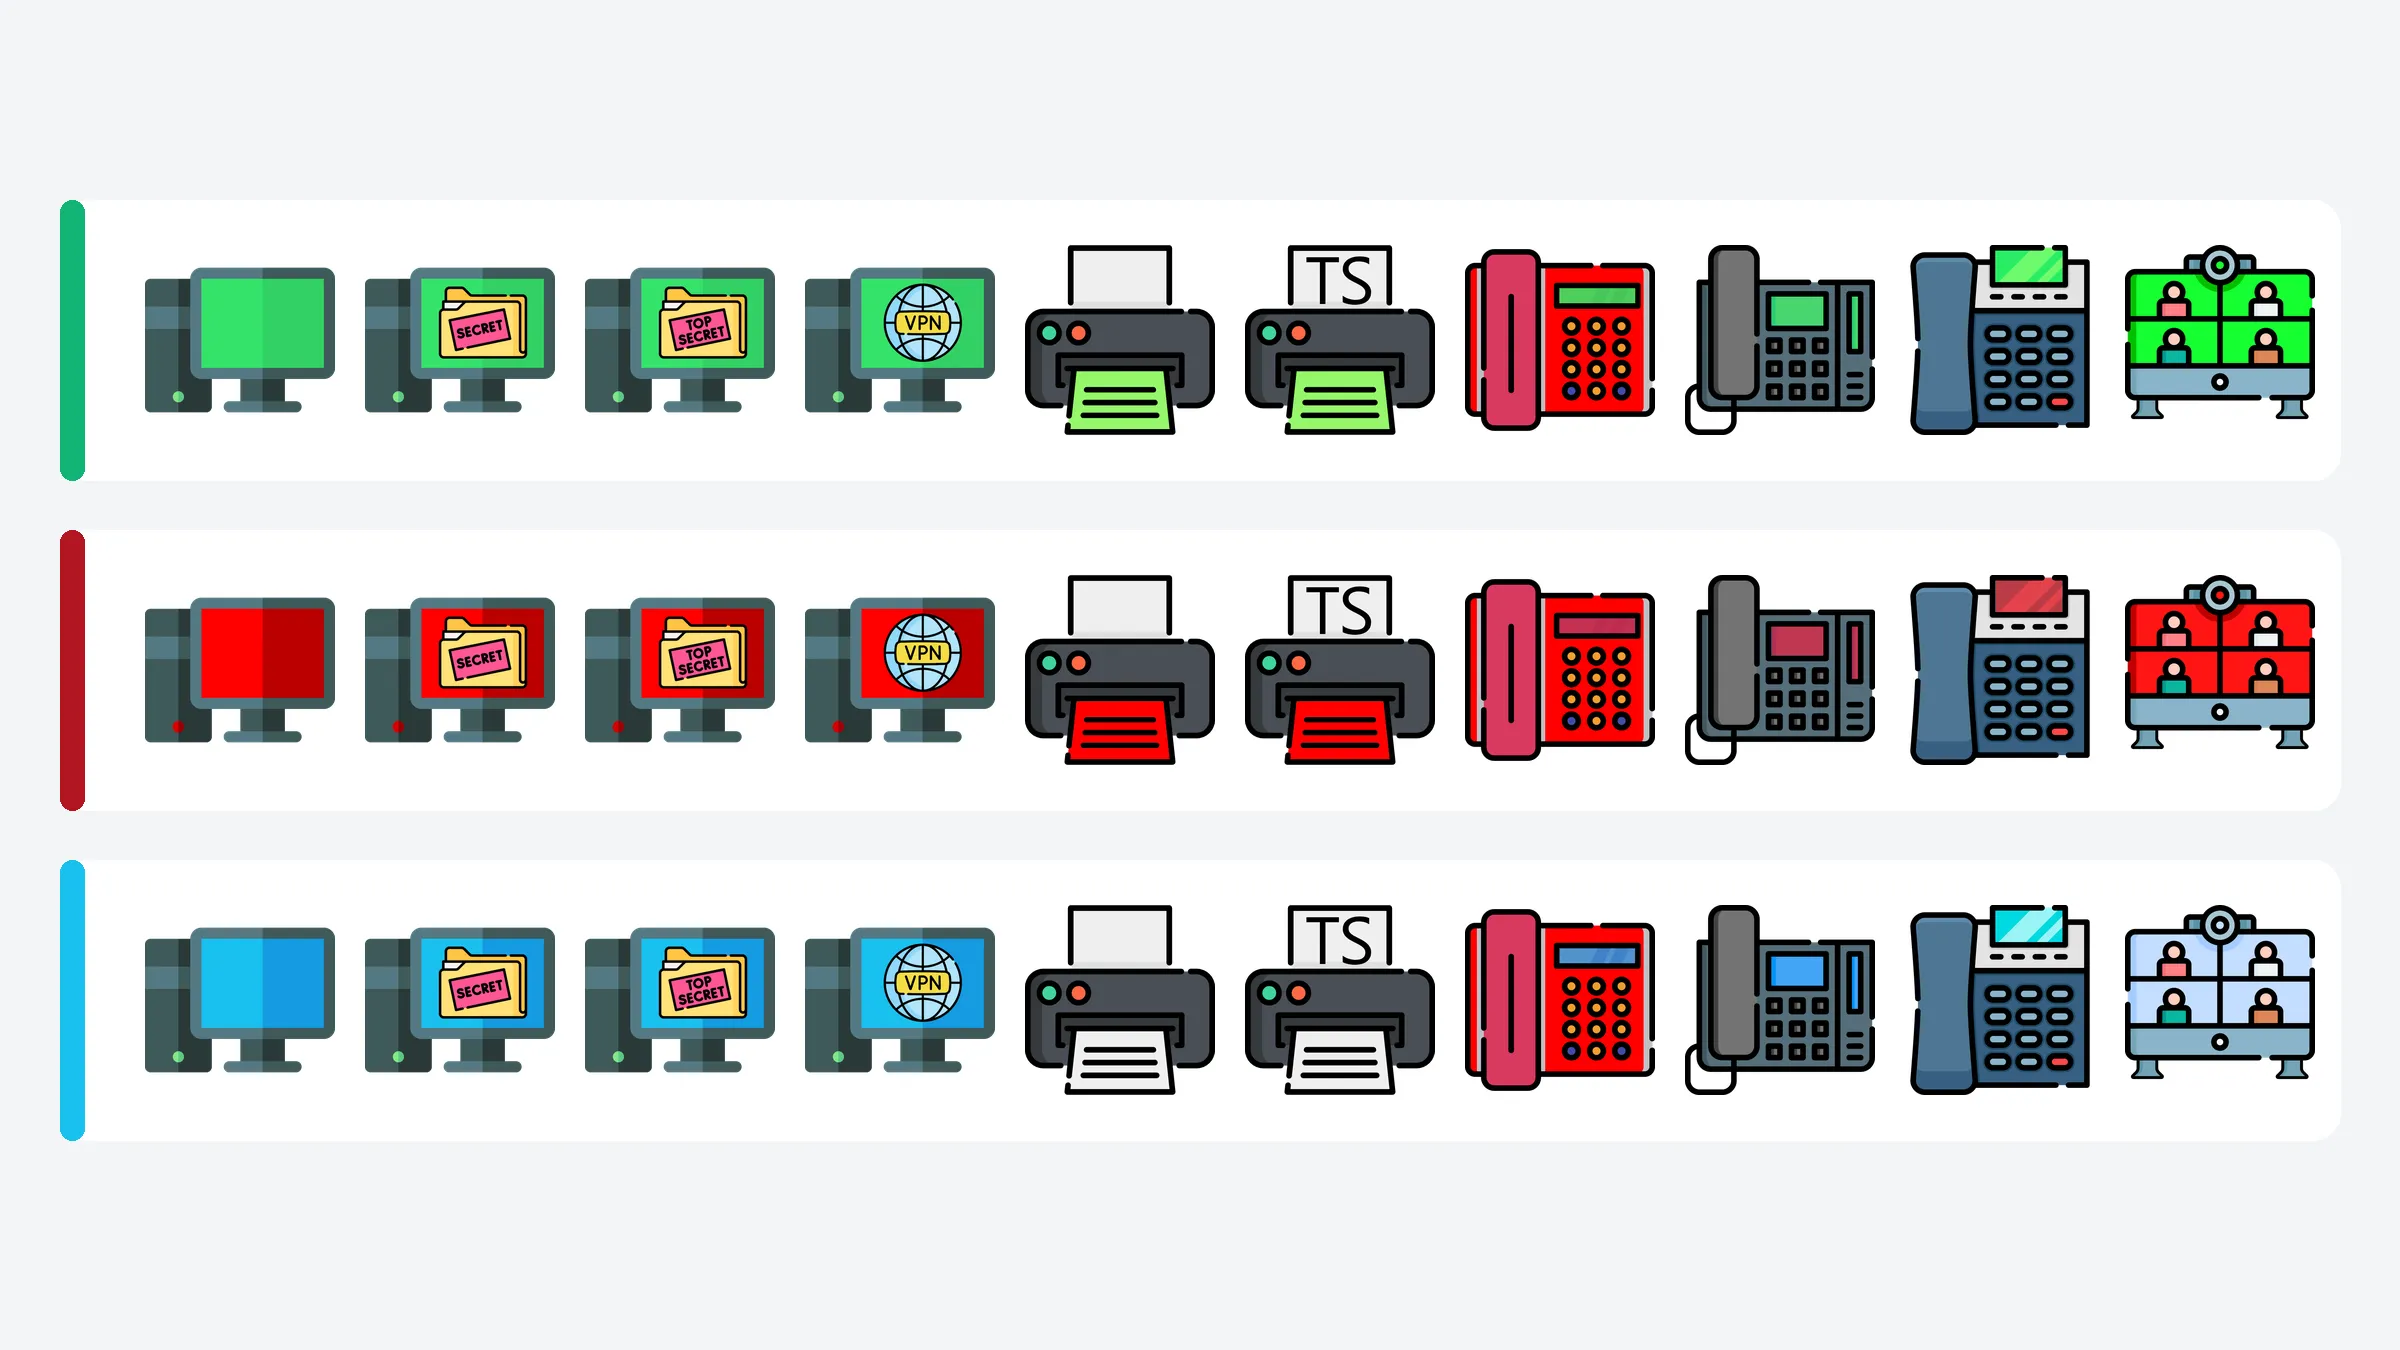
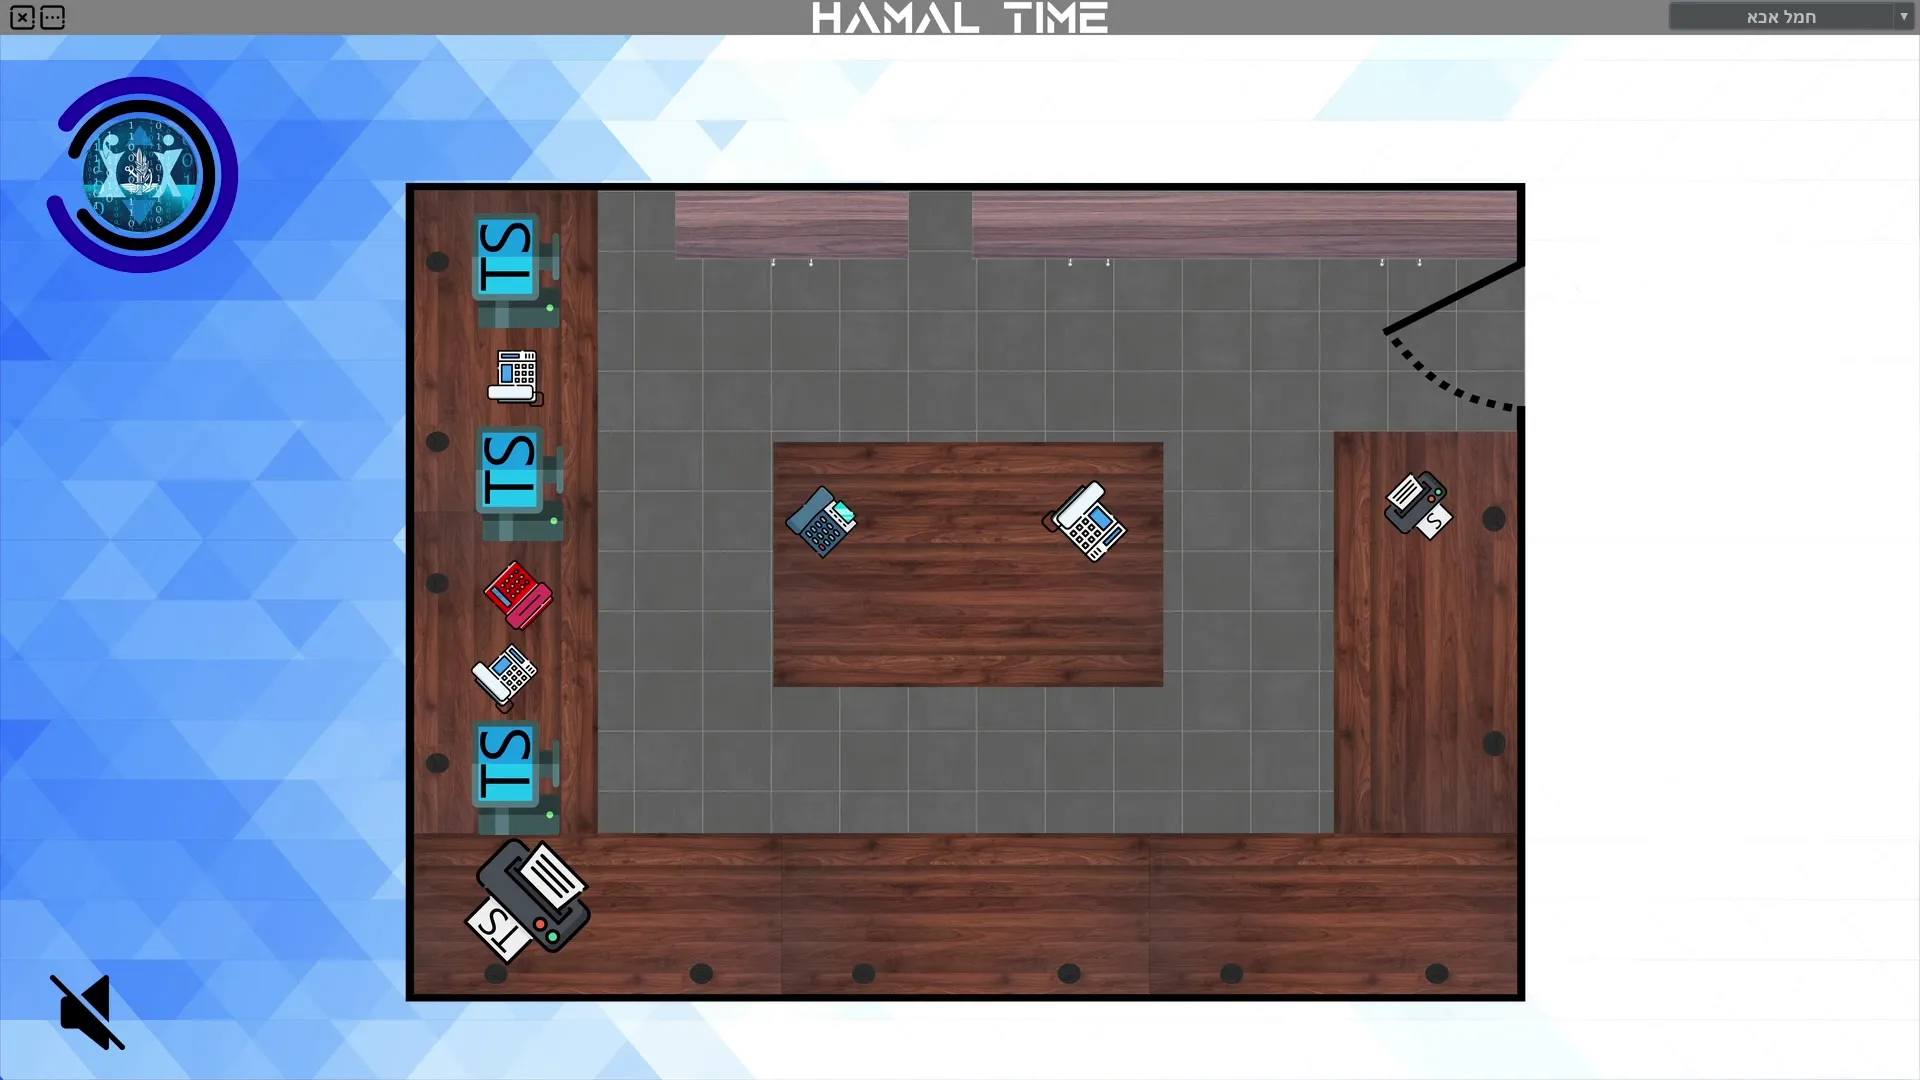
A full-screen Windows app that draws each room as a floor plan, with every device placed where it really stands. In the background the app checks every device: a working device shows green, a failed one turns red and blinks, and an alarm sounds. Clicking a device opens its full record.
It started with a single hamal. Release by release I grew it into a monitoring app built for many sites: a side panel that lists regions, bases, ops rooms and cells, with a status chart at every level, two editions chosen by the licence, and a proper installer.
How it came together
- Oct 202325 days, brief to productionThe first release, built in wartime for one hamal: floor plans, live checks, alarms, device records, edit mode and an installer.
- Nov 2023Two editions, many sitesA side panel of regions, bases, ops rooms and cells with status charts, plus two editions and licences.
- Dec 2023One app, licence picks editionBoth editions merged into one app; the licence decides which one runs. A monitoring switch per device, new record fields.
- Dec 2023Location cards and mapsA contact card with a map for every region, base and ops room, plus more reliable saving.
- Feb 2024Version 2.4.2A big code clean-up, a network-only view, new device types, free rotation, and a room-plan drawing tool in the installer.
- Sep 2024Next step: a browser versionI started a web version of the same region-to-device view.
03 / Highlights
The room at a glance
Each room is a floor plan showing every device, so a failed one is found on the plan, not in a list.
Alarms no one misses
Devices are checked at a set interval. A failed one turns red and blinks, and one of five alarm sounds plays.
A full device record
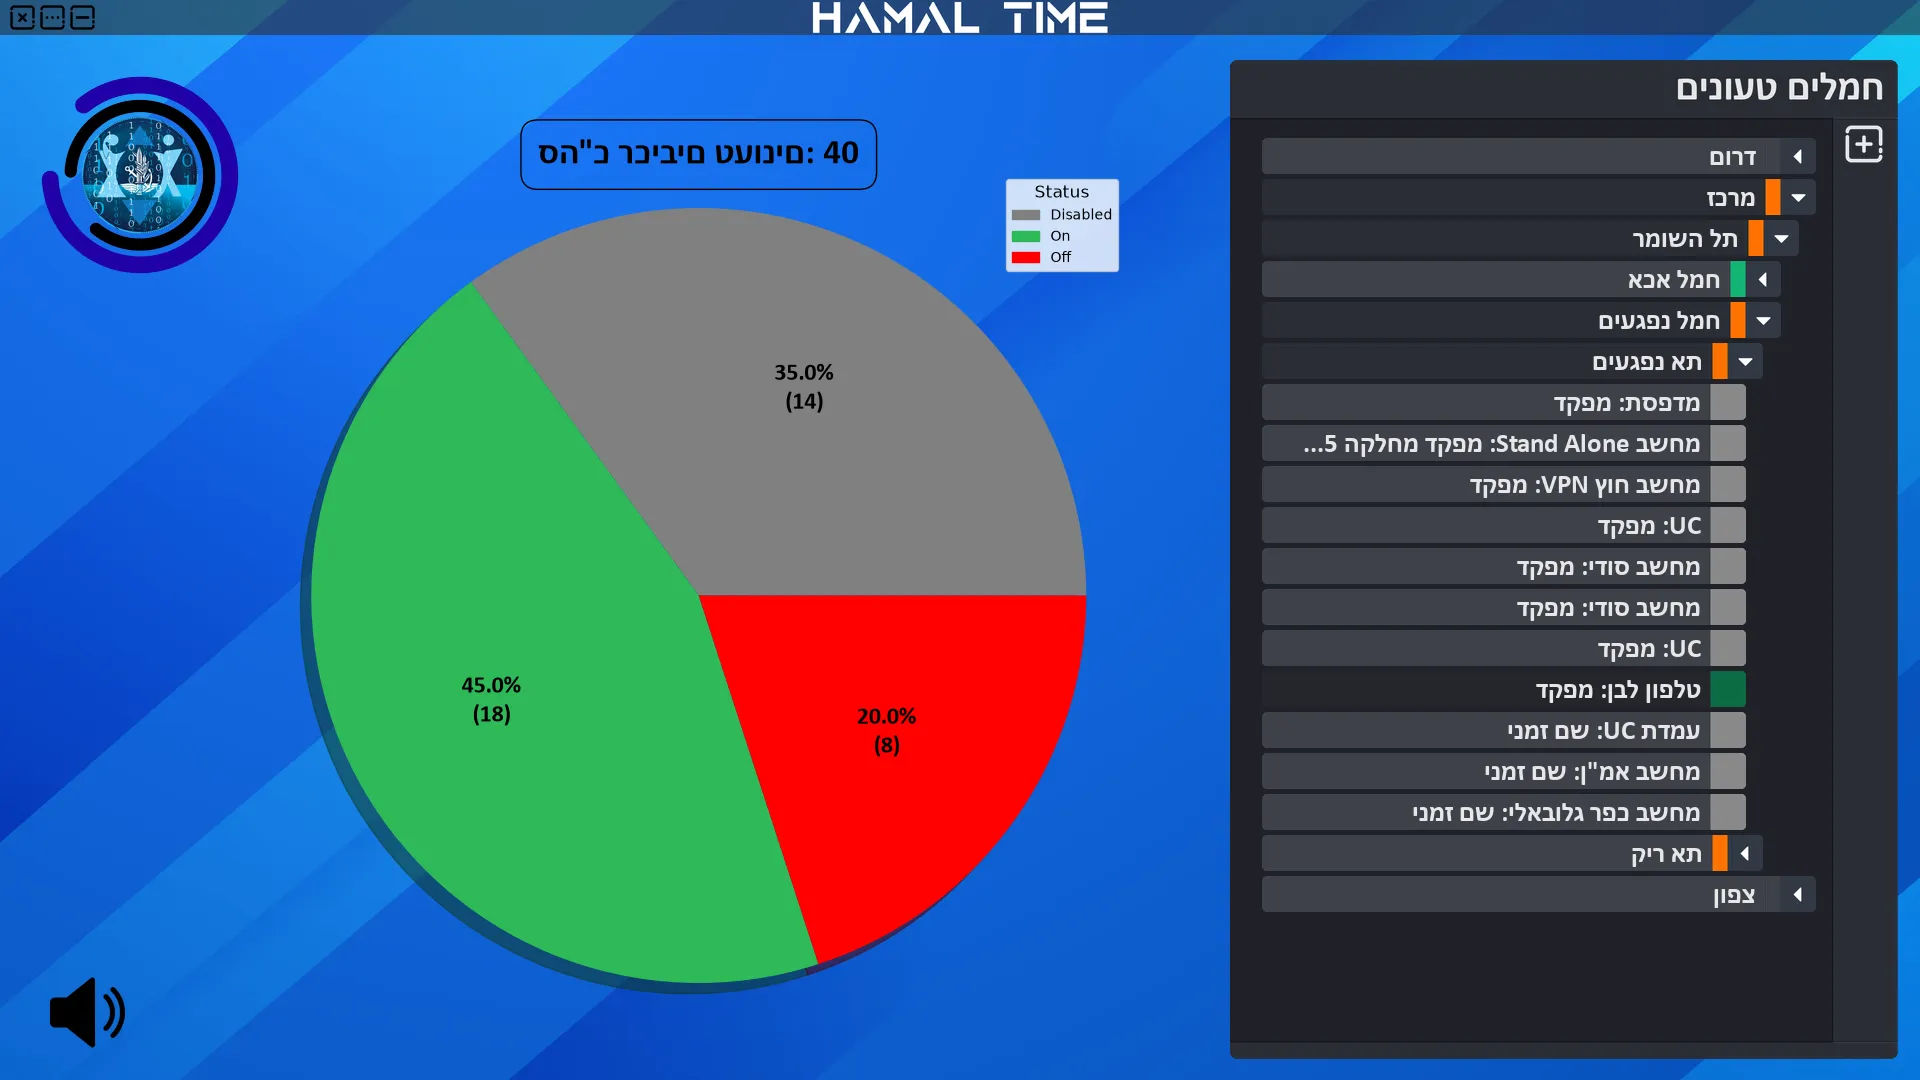
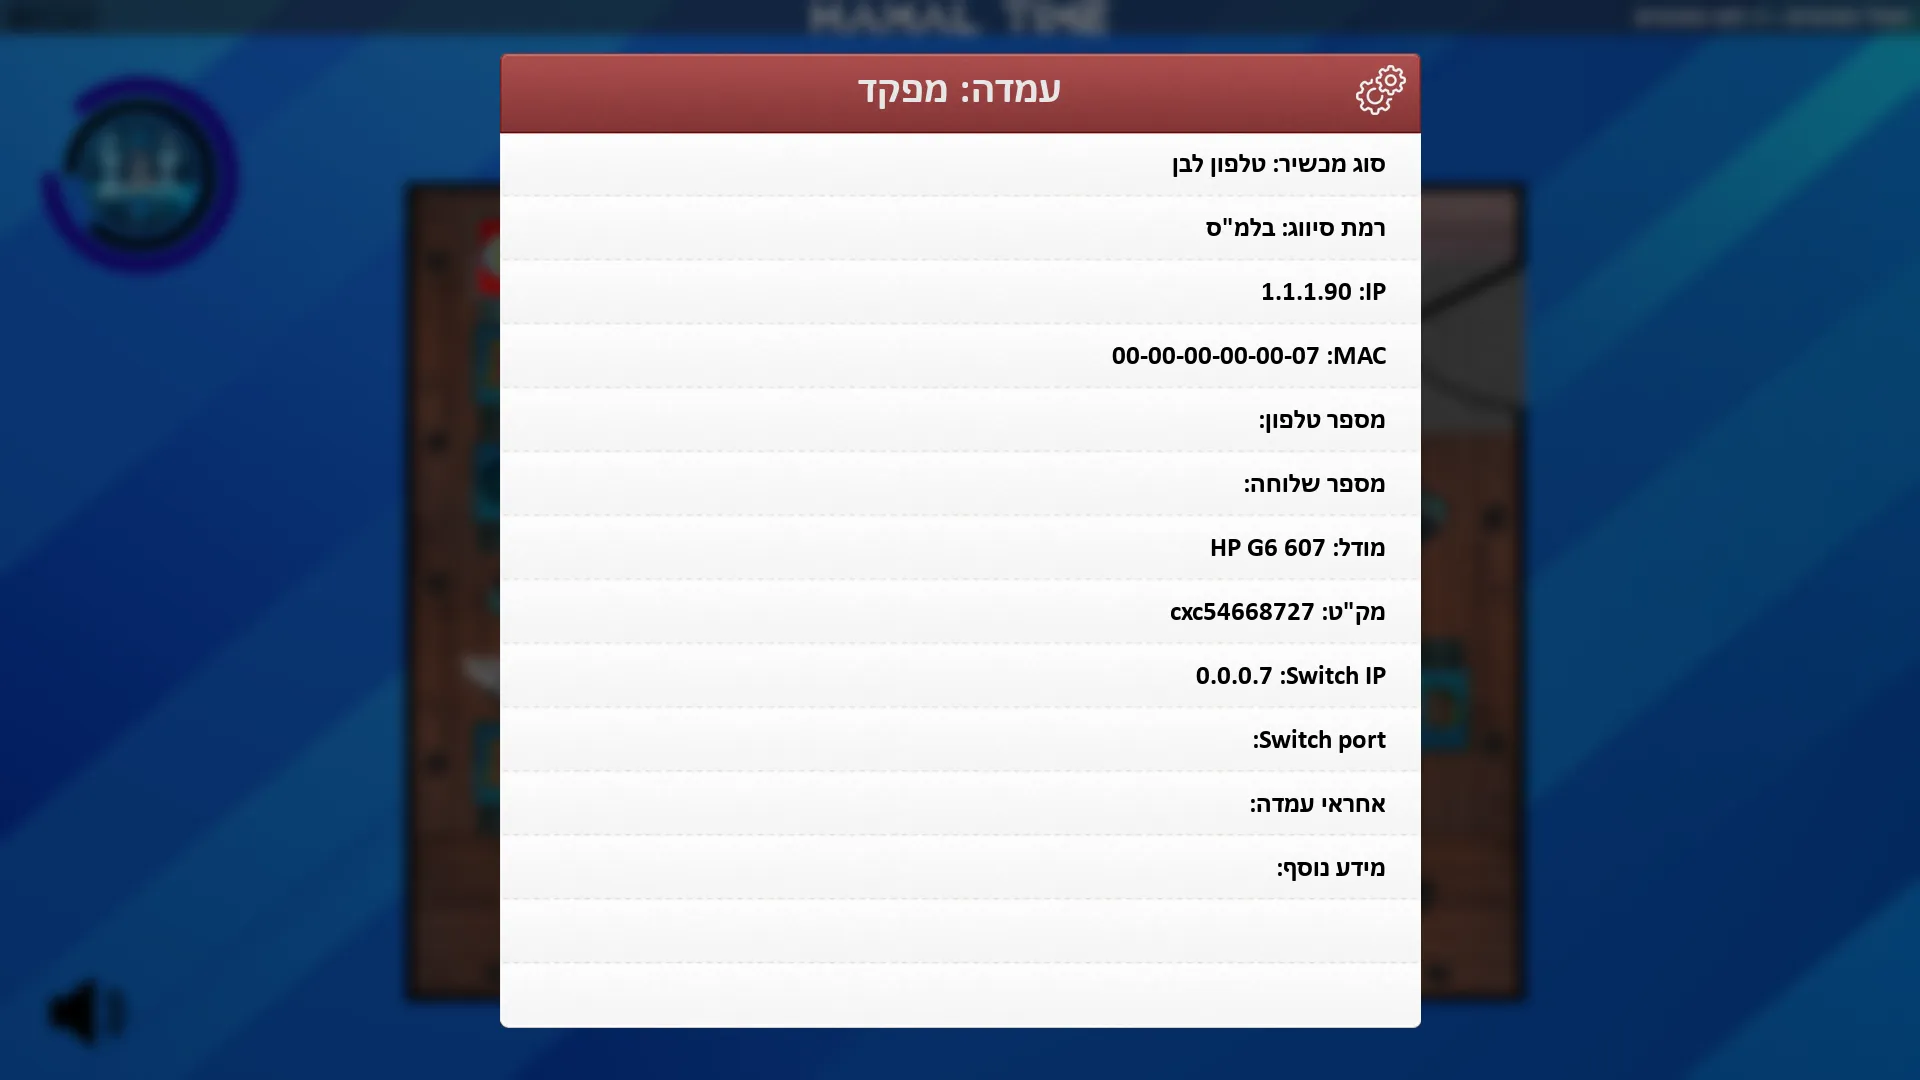
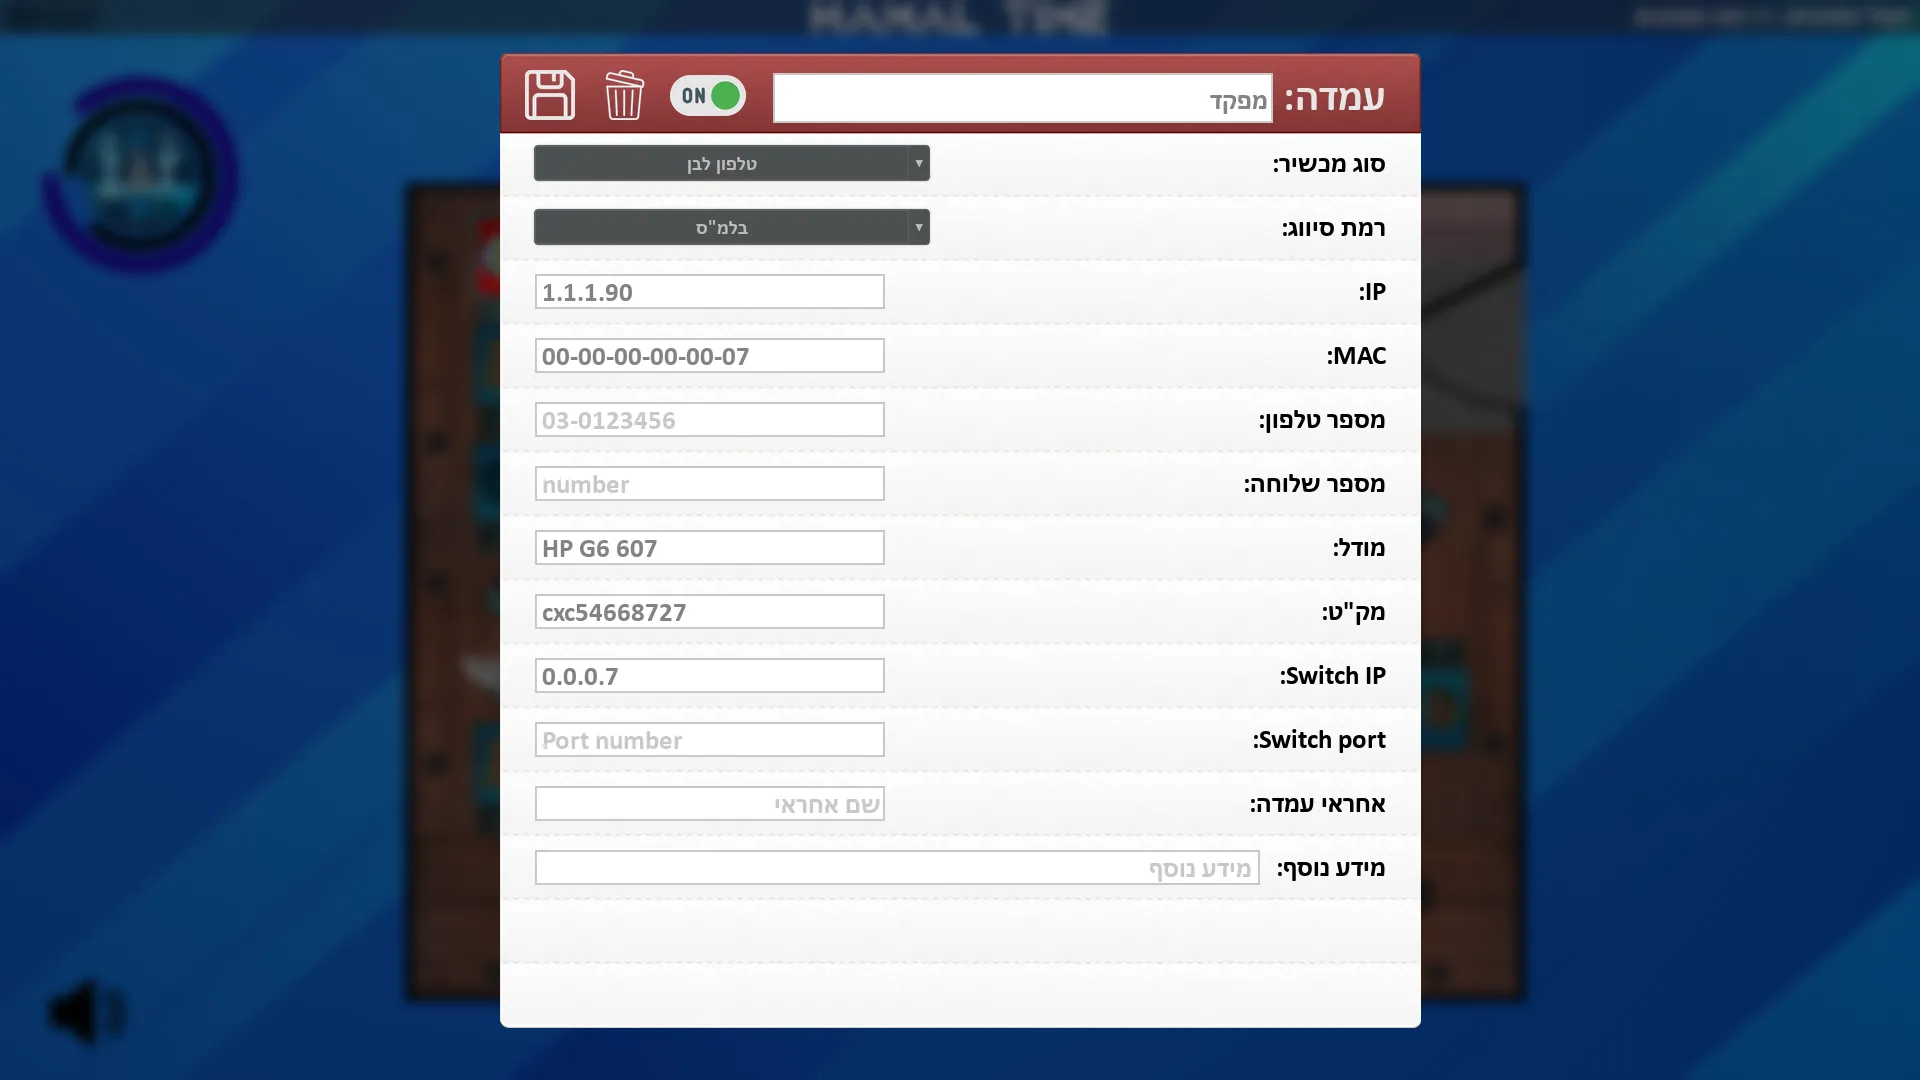
One click shows everything about a device: where it sits, what it is, its classification, network addresses, computer name, model, serial number and the network port it is plugged into.
One room to a region
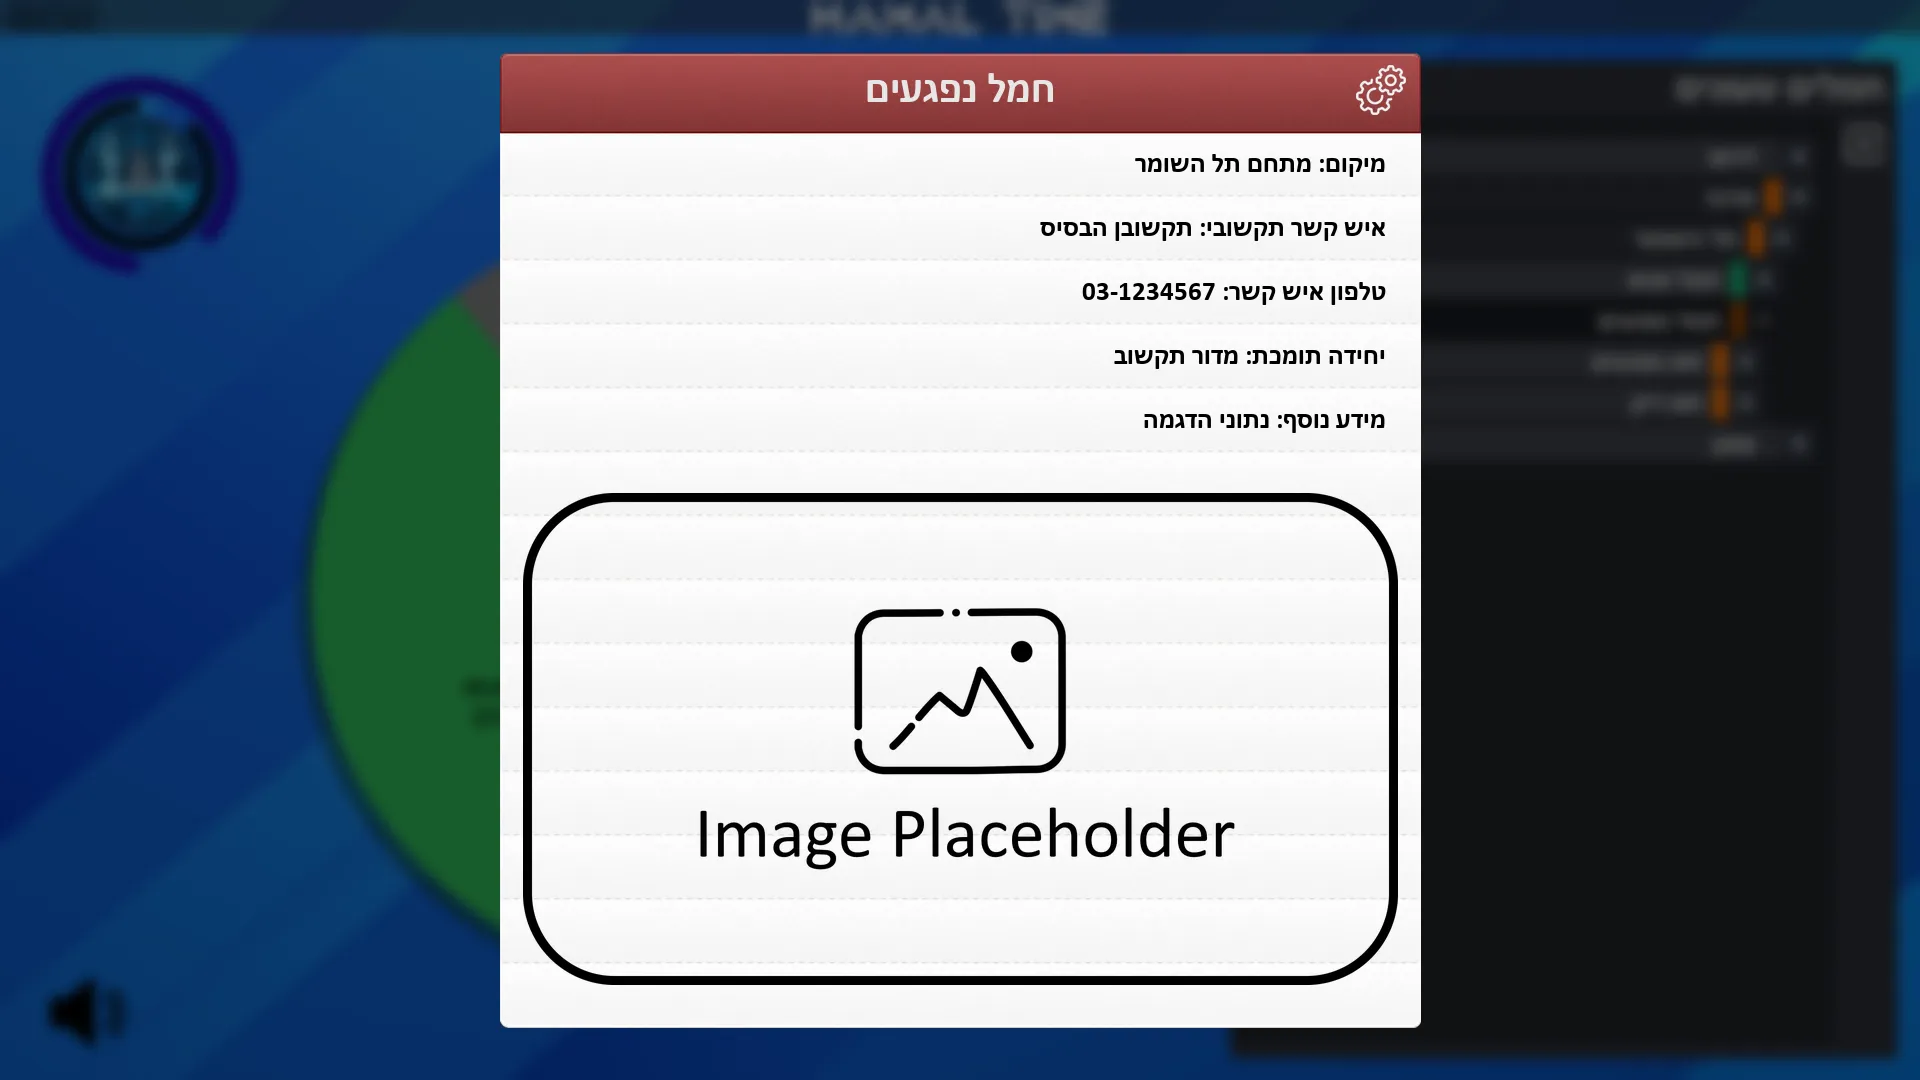
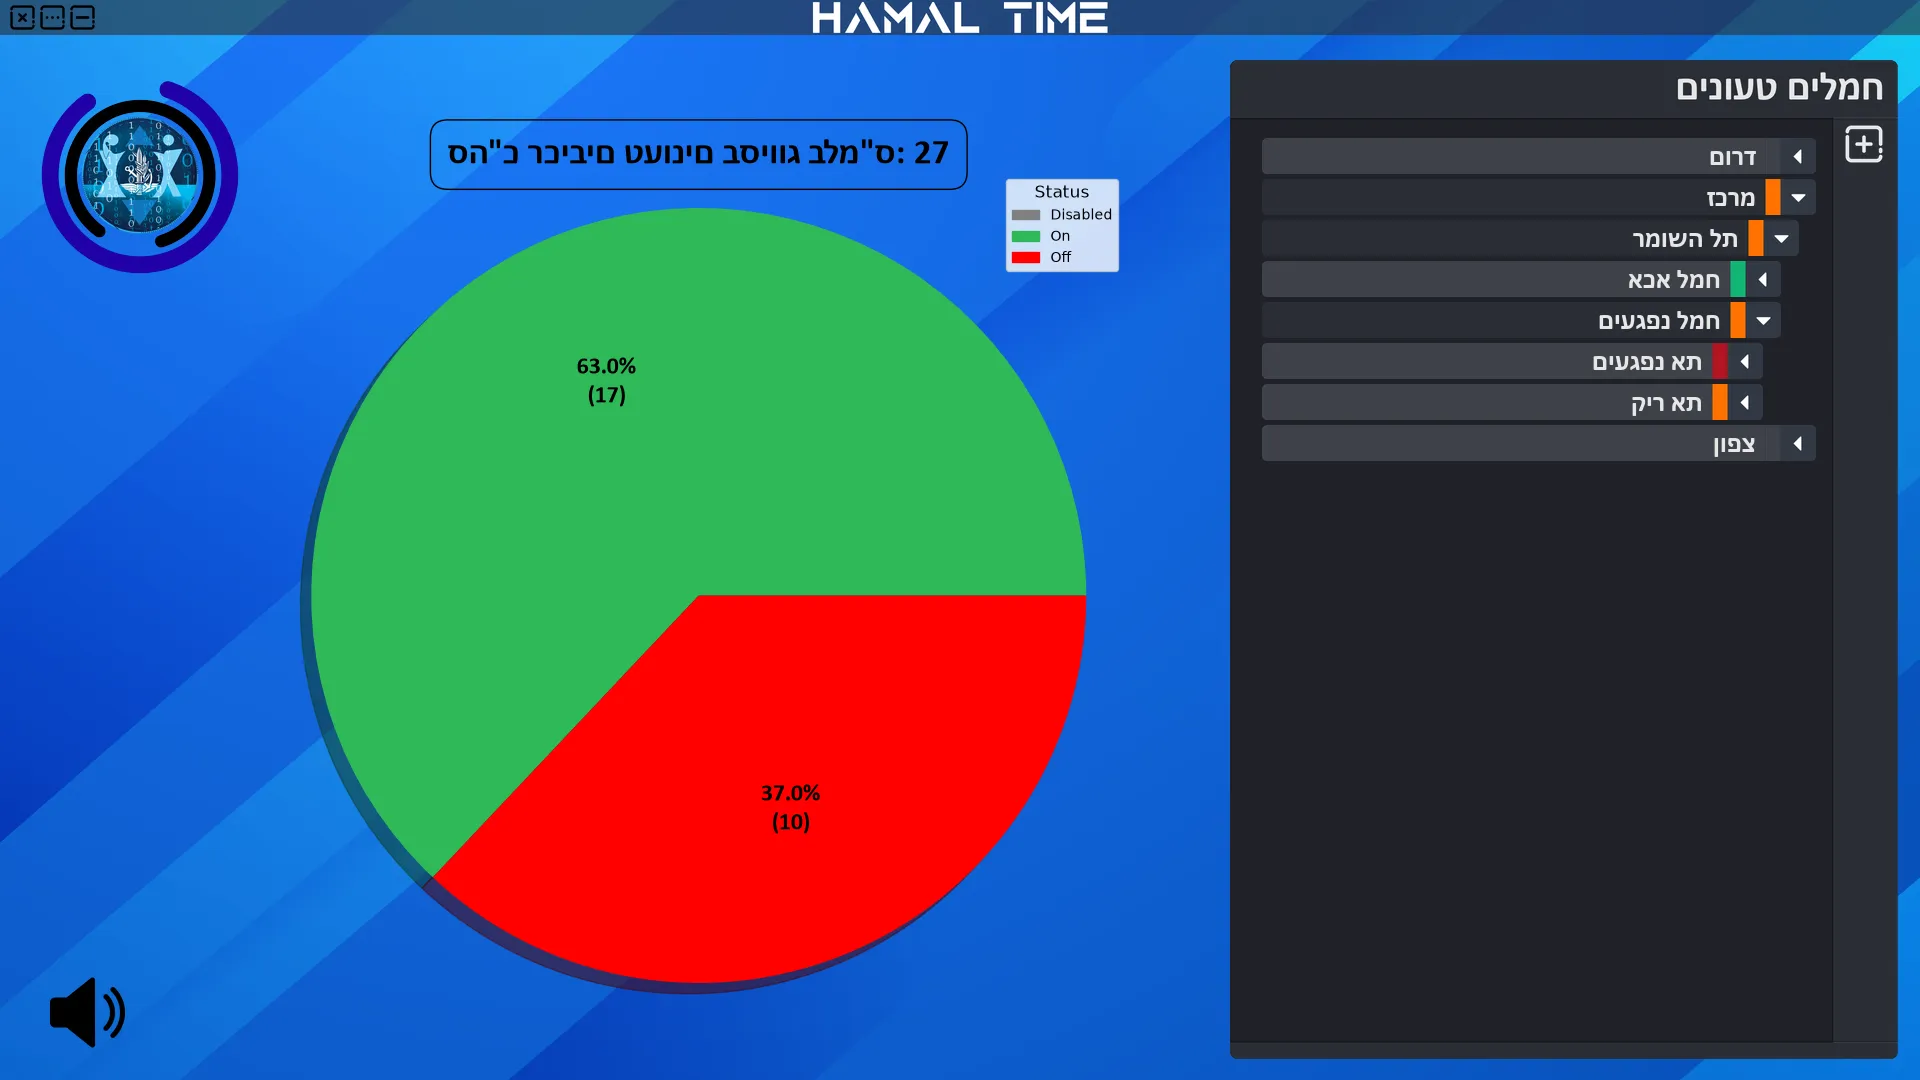
A side tree lists regions, bases, ops rooms and cells, with a live status chart for each and a location card for every site.
Knows its own network
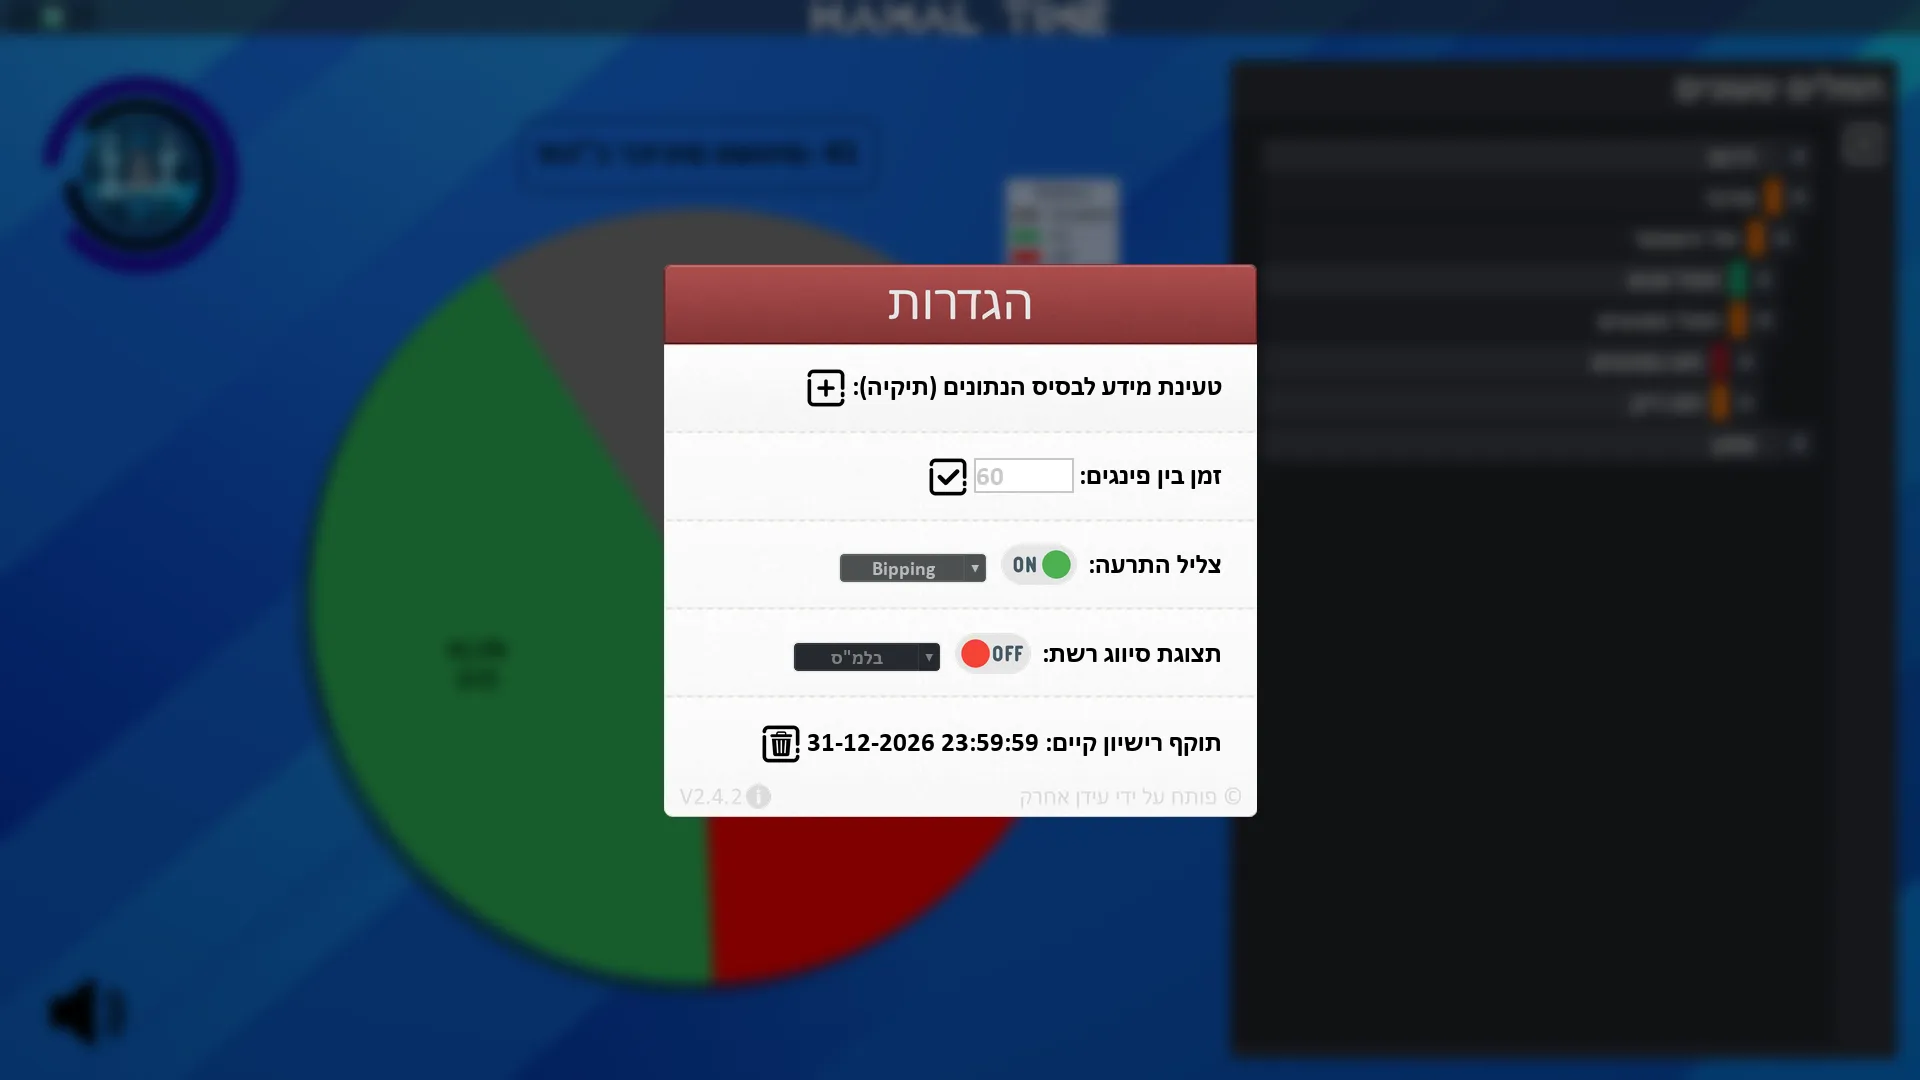
Warns when the station itself is cut off, so a fault at the station never looks like every device failing. Devices it cannot reach are dimmed, and every chart can show one network at a time.
Installer and licences
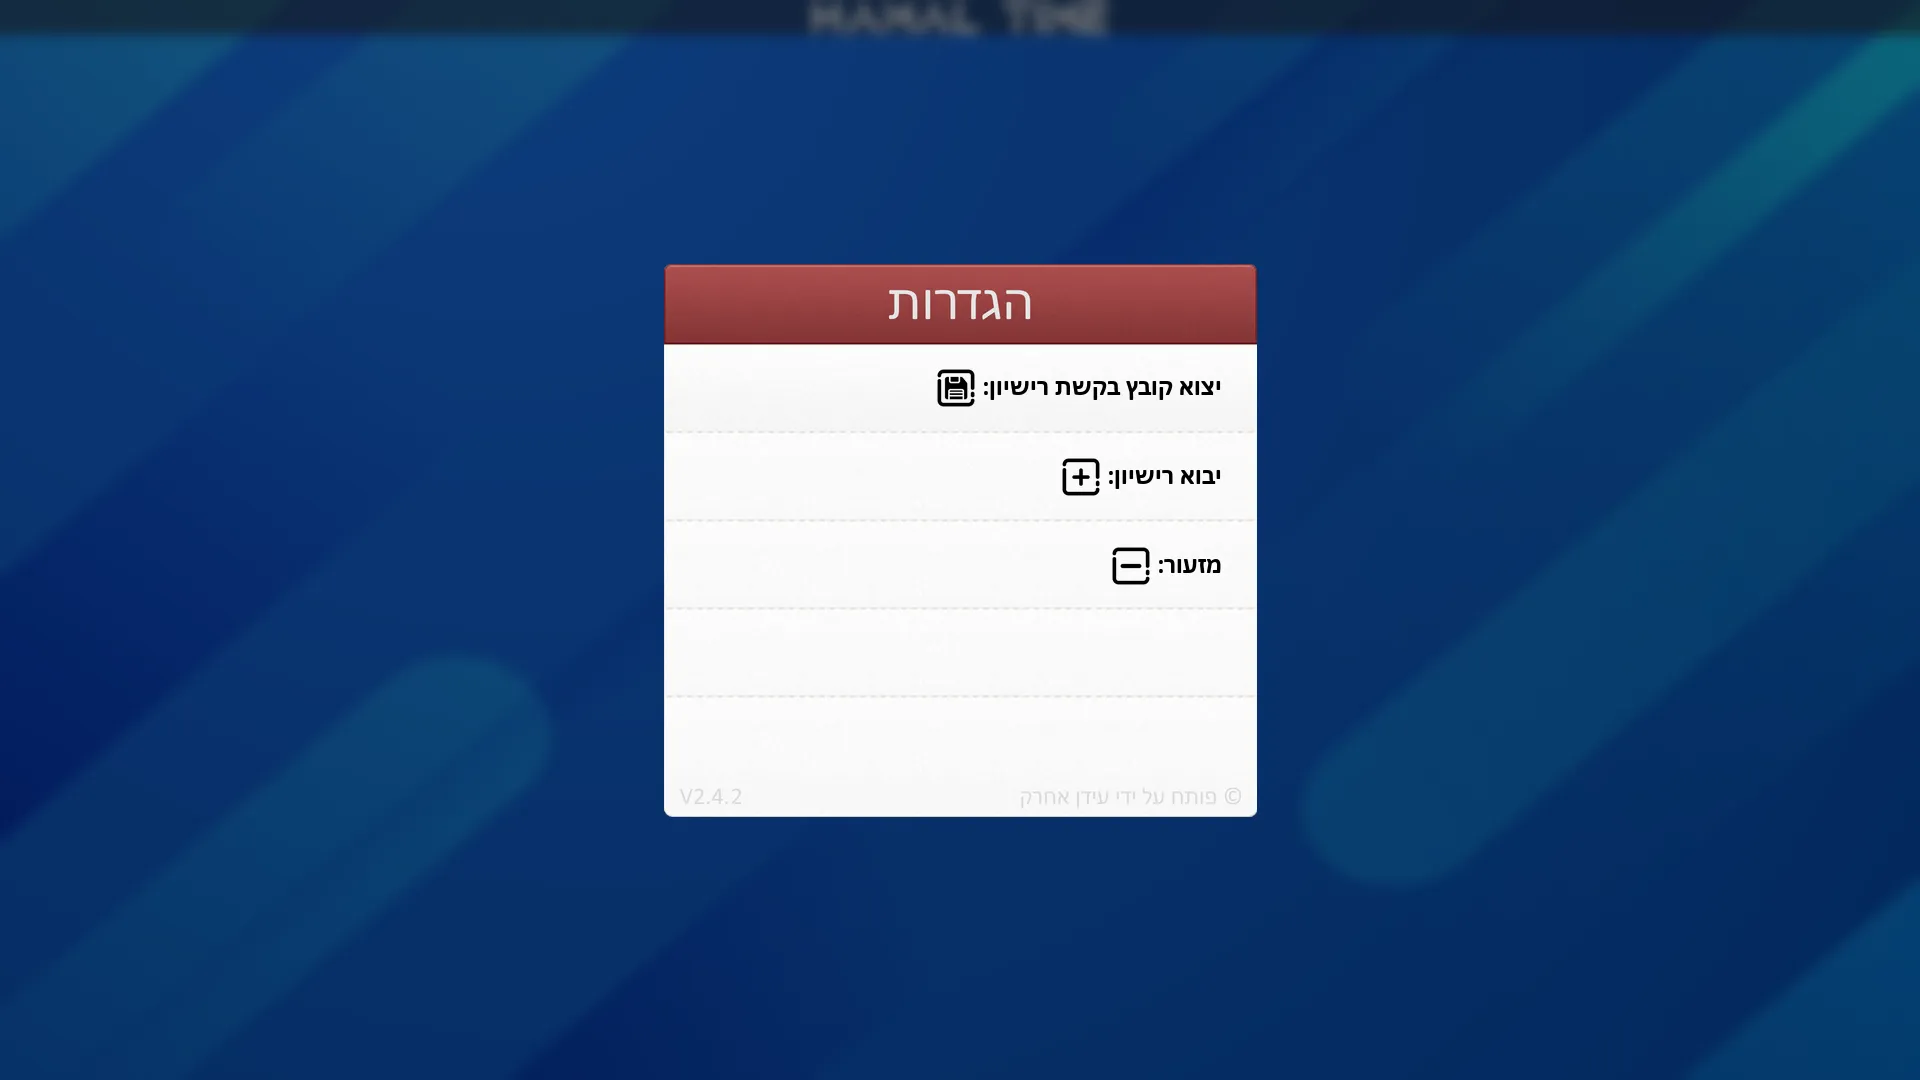
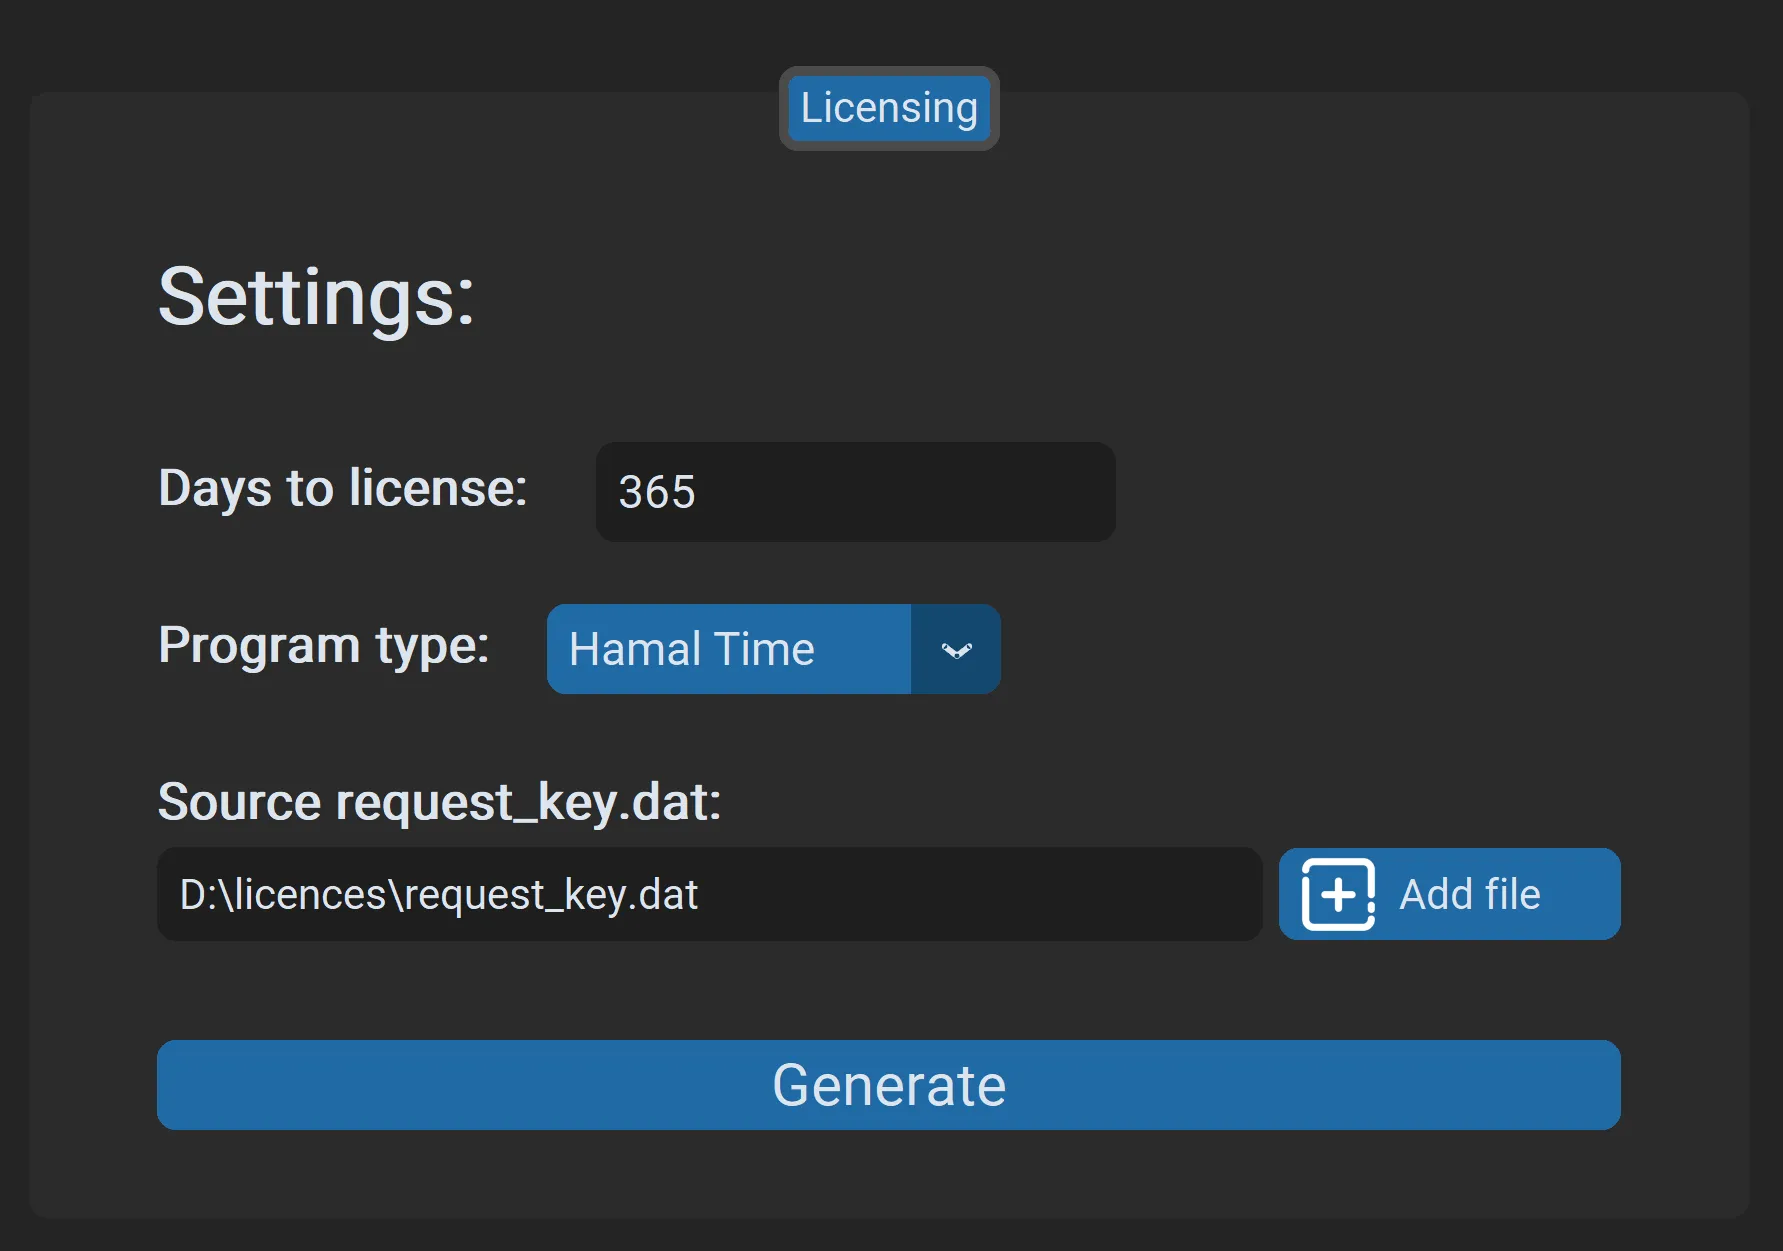
An installer, two editions, and a licence for each monitoring station, bound to that computer and an expiry date and issued with my own tool.
04 / Screens
18 screens · sample data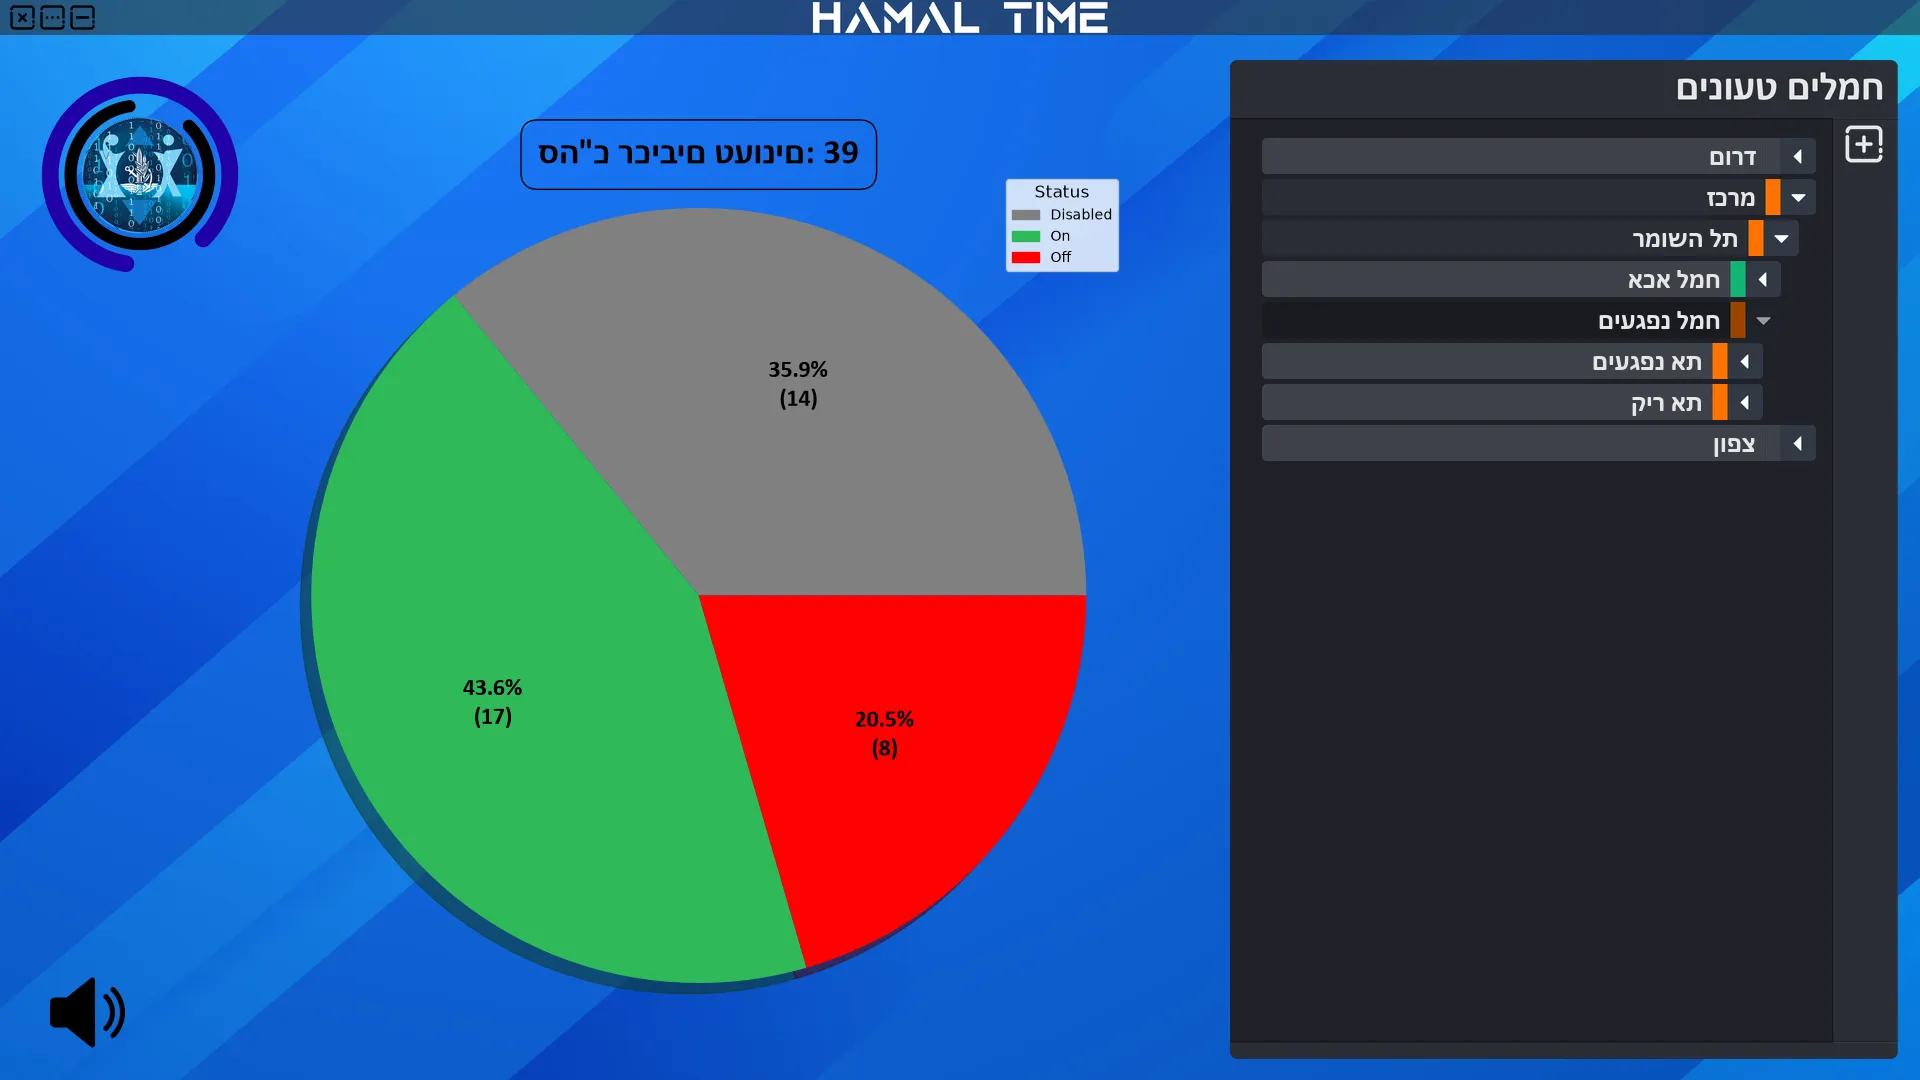


05 / Impact
The app was installed on 4 monitoring stations and mapped 14 ops rooms across 5 bases, with more than 400 devices under watch. It was used by 8 IT and ops-room staff, and I issued 4 licences, one for each monitoring station.
With the app, a failed device shows up the moment it stops responding: staff find it on the plan, with its details at hand, instead of searching a spreadsheet.
06 / Role and tech
I designed and built the whole product on my own: the screens, the data structure, the monitoring engine, the installer, the editions and the licensing. I shipped every release myself and issued licences with a tool I wrote for it.
It followed my earlier switch-monitoring tool, Project P.I.N.G.E.R., and took the same idea into the ops room.
Tech
- Python
- pygame
- pygame_gui
- pandas
- Excel
- matplotlib
- Pillow
- threading
- CustomTkinter
- PyInstaller
- Windows networking
How it's built
A full-screen Windows app in Python, built on my own reusable pygame widget code. Each cell's devices are kept in a plain Excel file next to its floor-plan image, inside a folder tree of regions, bases and ops rooms, with a backup on every save. Background threads ping the devices, play alarms and queue pop-ups, and the screen scales from a 4K design to any monitor. Charts are drawn with matplotlib, and PyInstaller packs everything into a portable app and an installer.
Delivered in 25 days in wartime for a single ops room, it grew in about three months into a monitoring app for many sites.