T100
A web app built for an AKA-led event so teams could track their work toward the goals set by the head of AKA.
01 / The challenge
For T100, an event led by AKA, teams had to work together toward goals set by the head of AKA. The work was organised into broad initiatives, concrete plans and day-to-day tasks, and one piece of work could belong to several teams at once.
Plans like this usually live in a spreadsheet, one row per task. A spreadsheet can list the work, but it struggles with the simple questions: how far along is each initiative, which team owns what, and what is already late? And the progress had to be presented clearly at the event itself.
- Three levels: initiatives, plans and tasks
- Work shared between several teams
- Late work hard to spot
- Progress to present at the event
02 / What I built
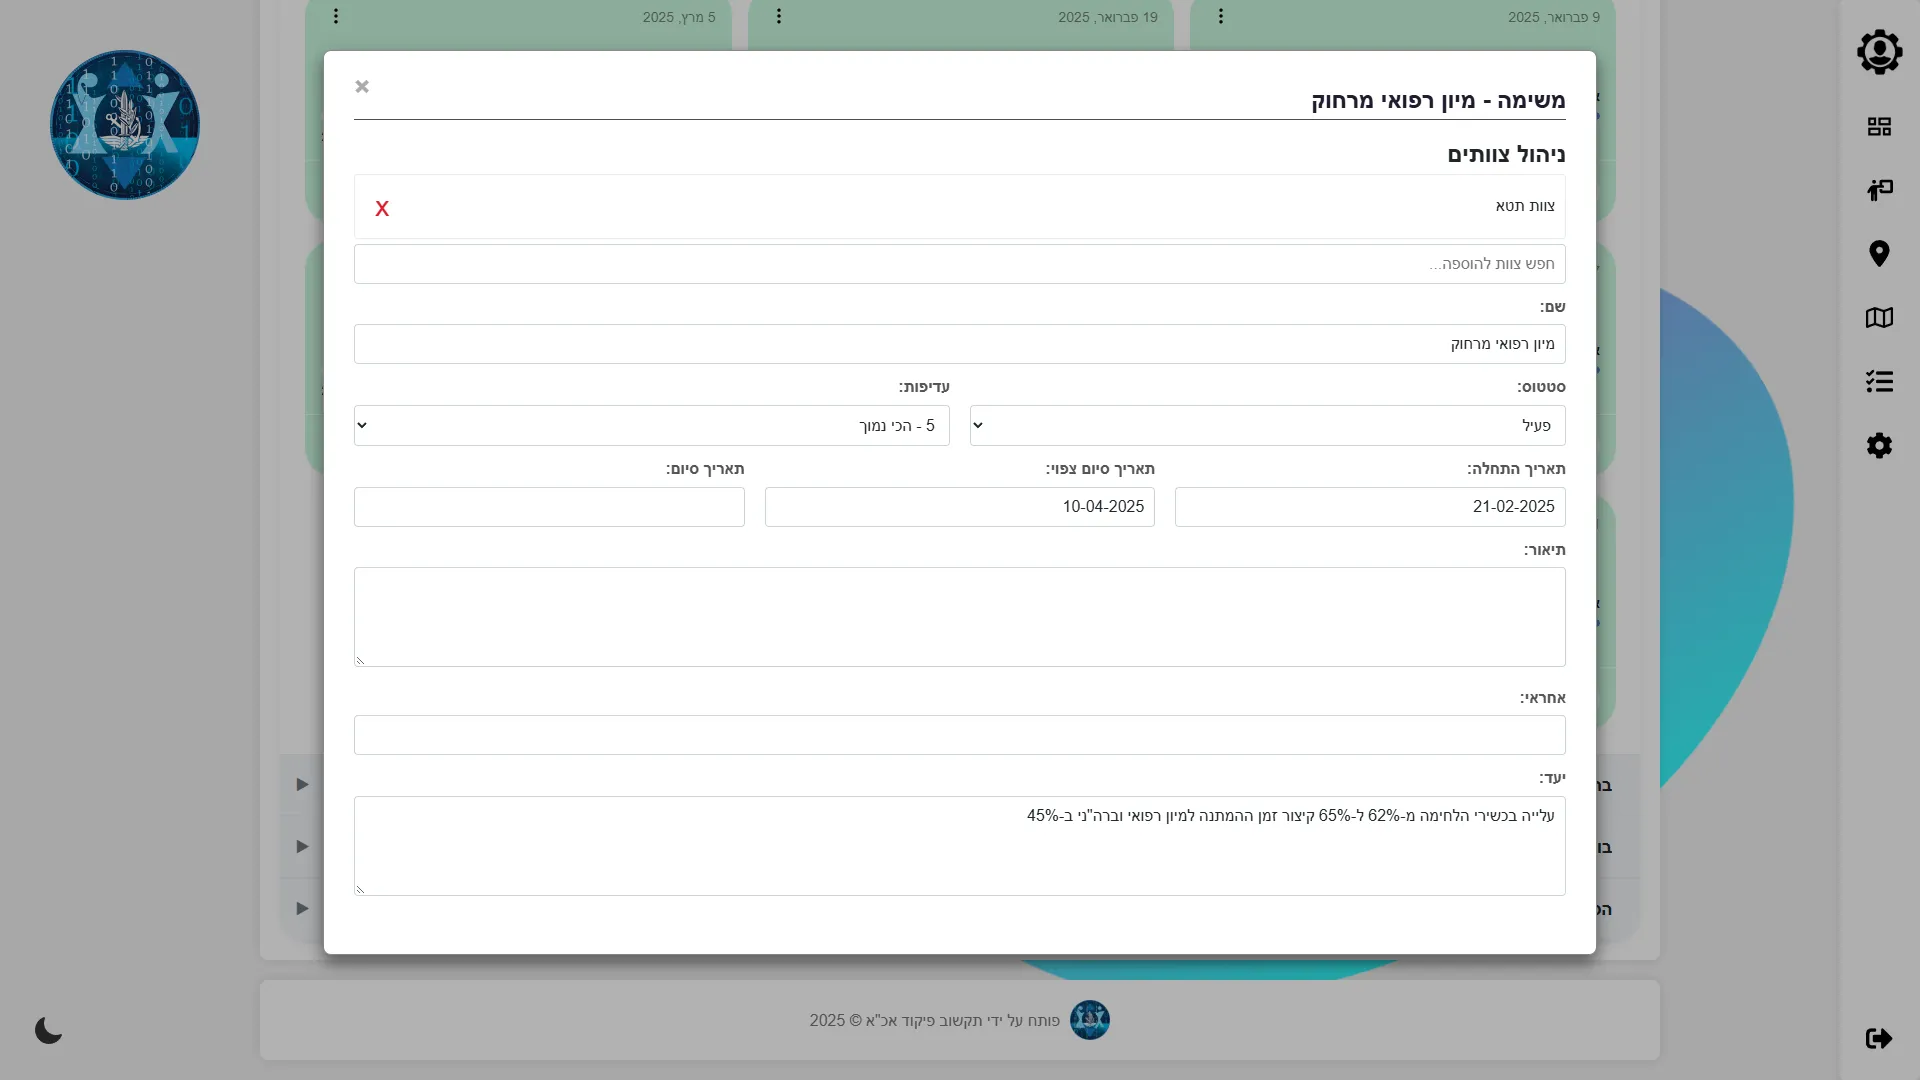
I built T100, a Hebrew web app that turns the plan into a living structure: initiatives contain plans, plans contain tasks, and every item can be assigned to one or more teams. Each task can record the measurable goal it serves, and completion is worked out automatically from task statuses, for every plan and every initiative.
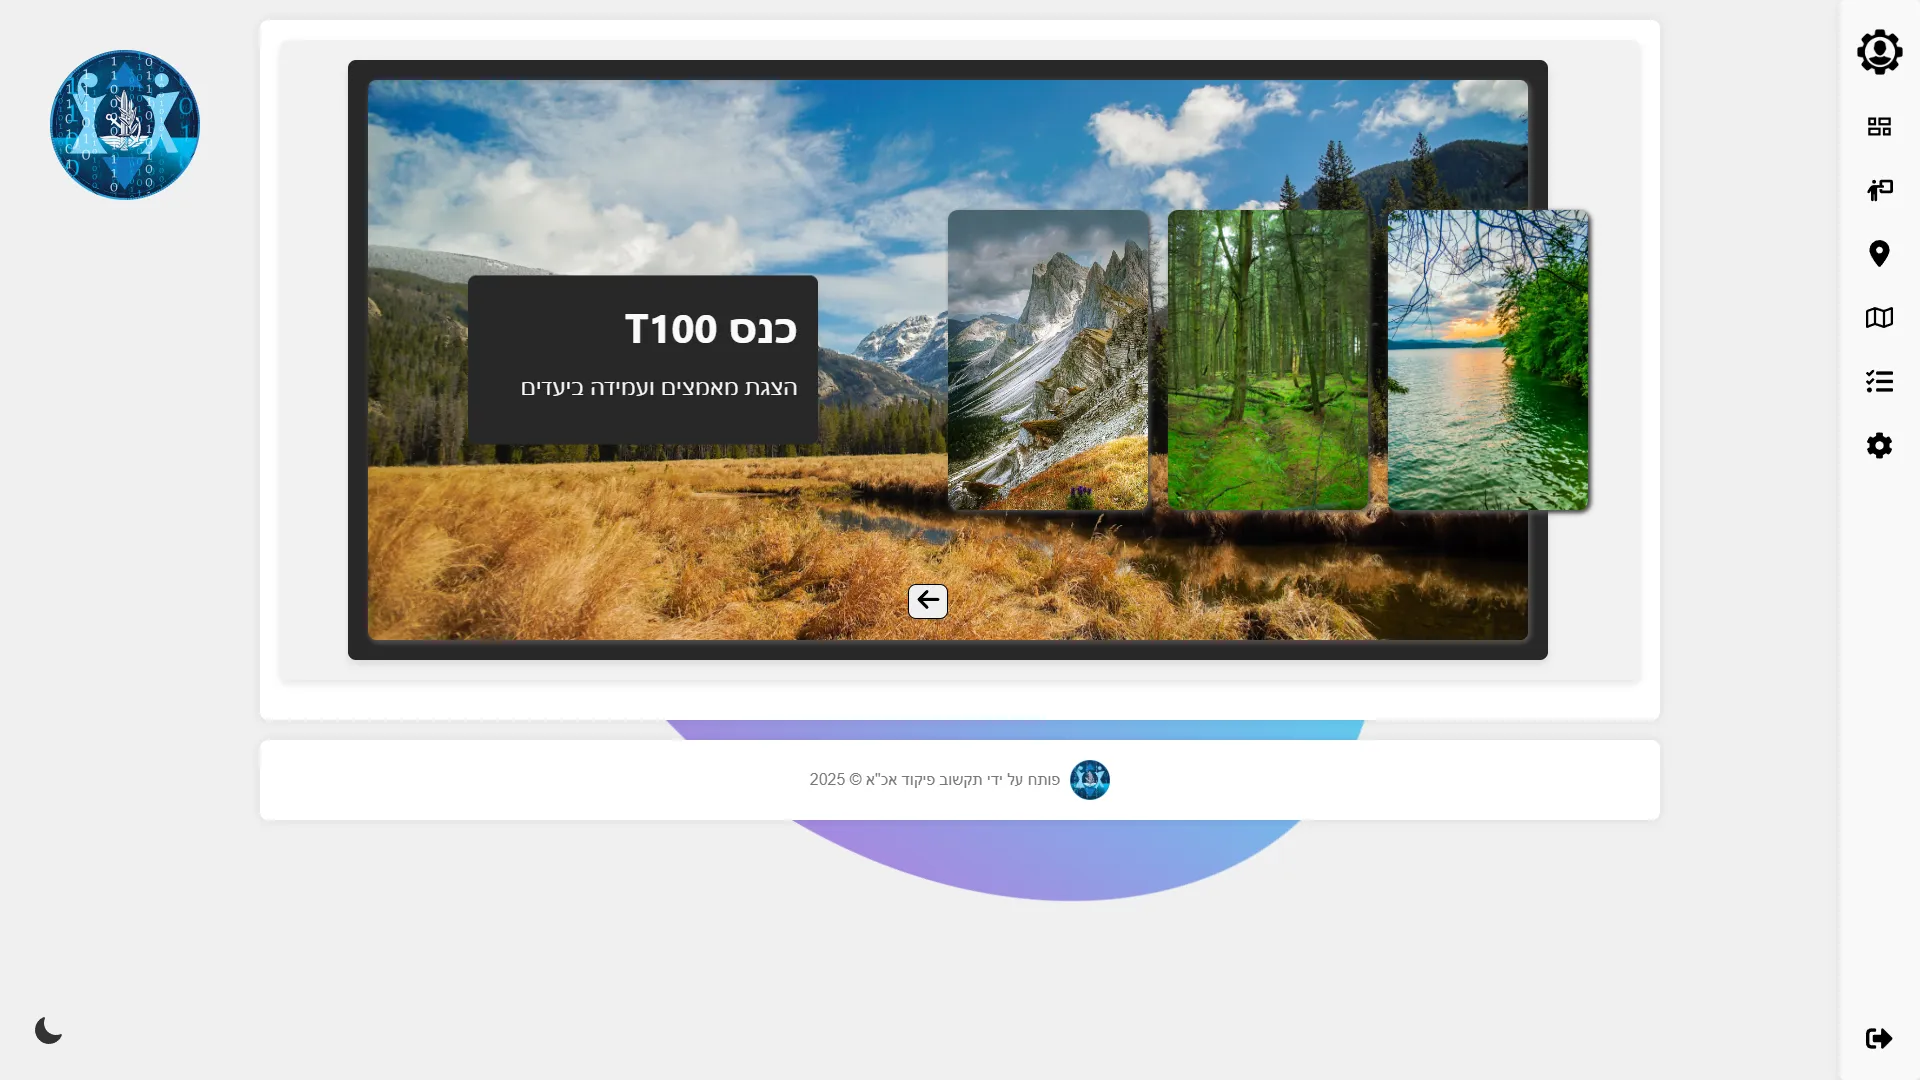
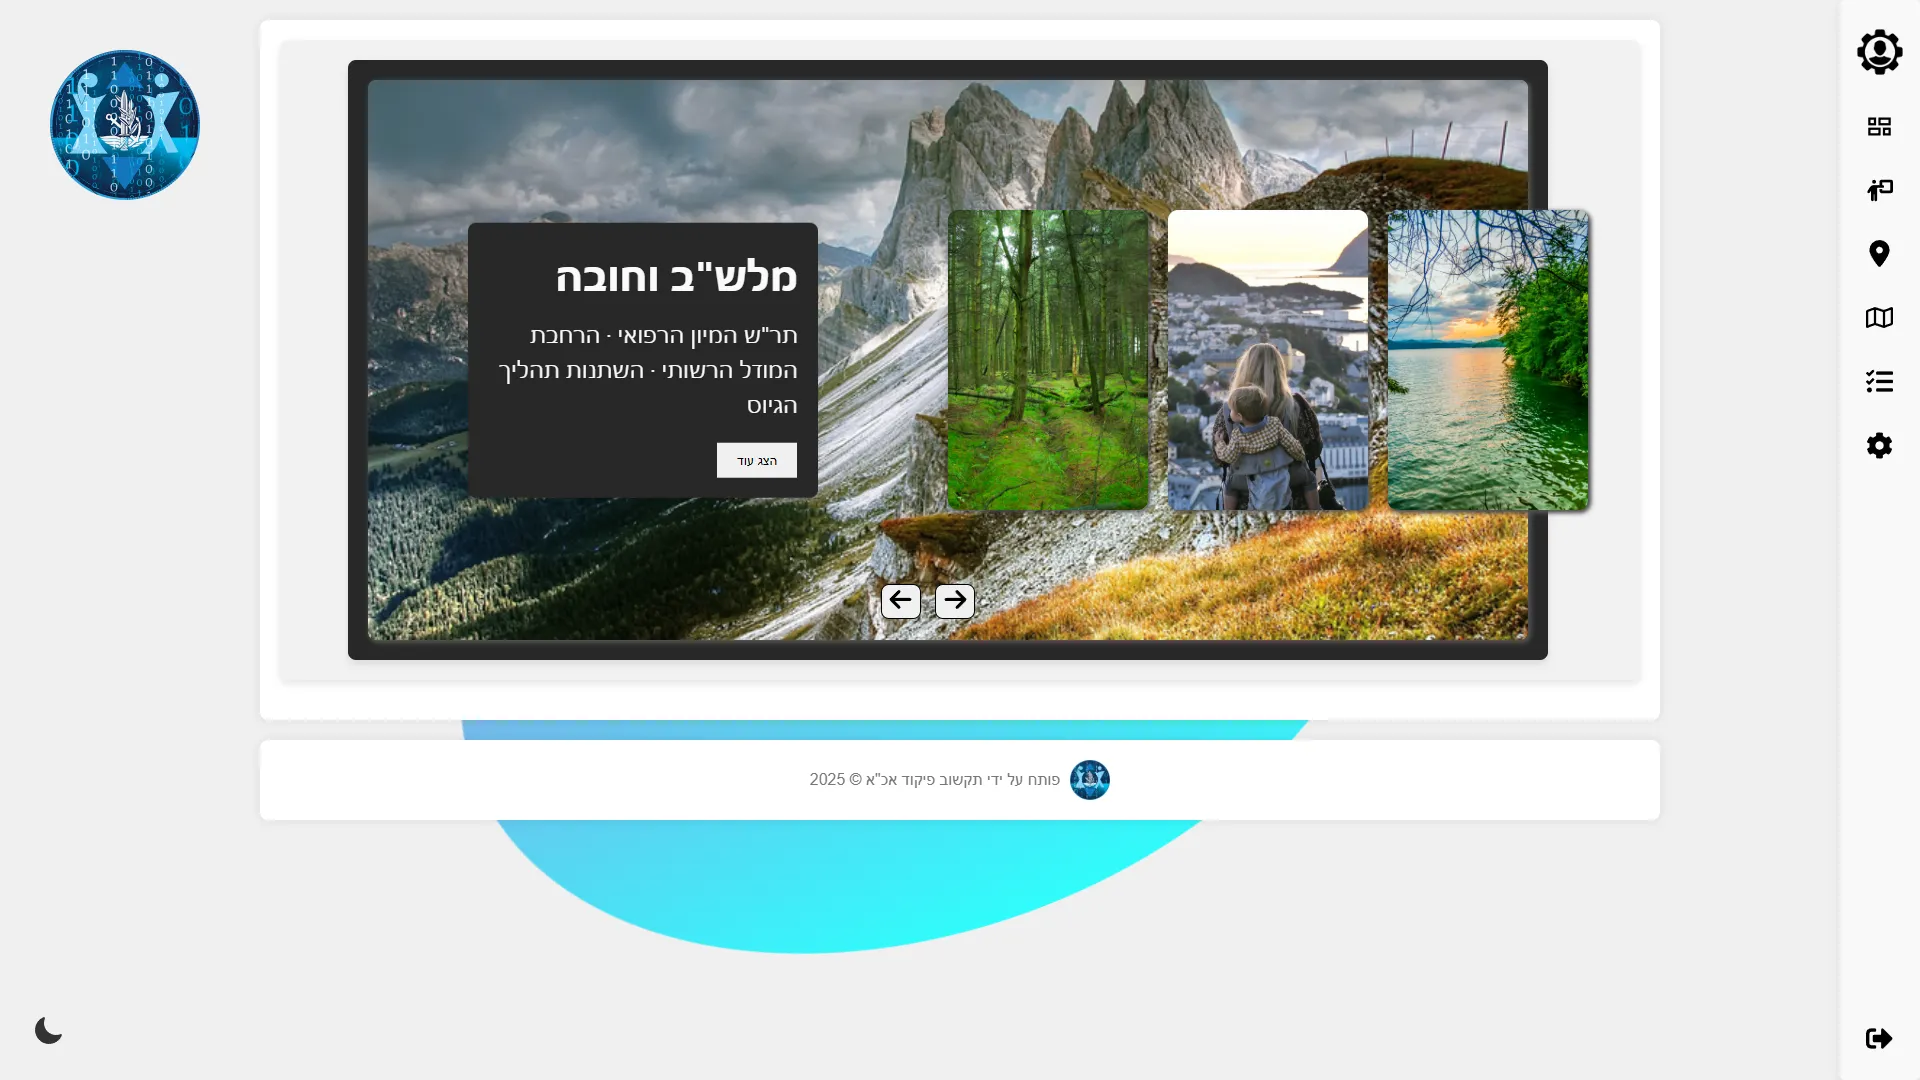
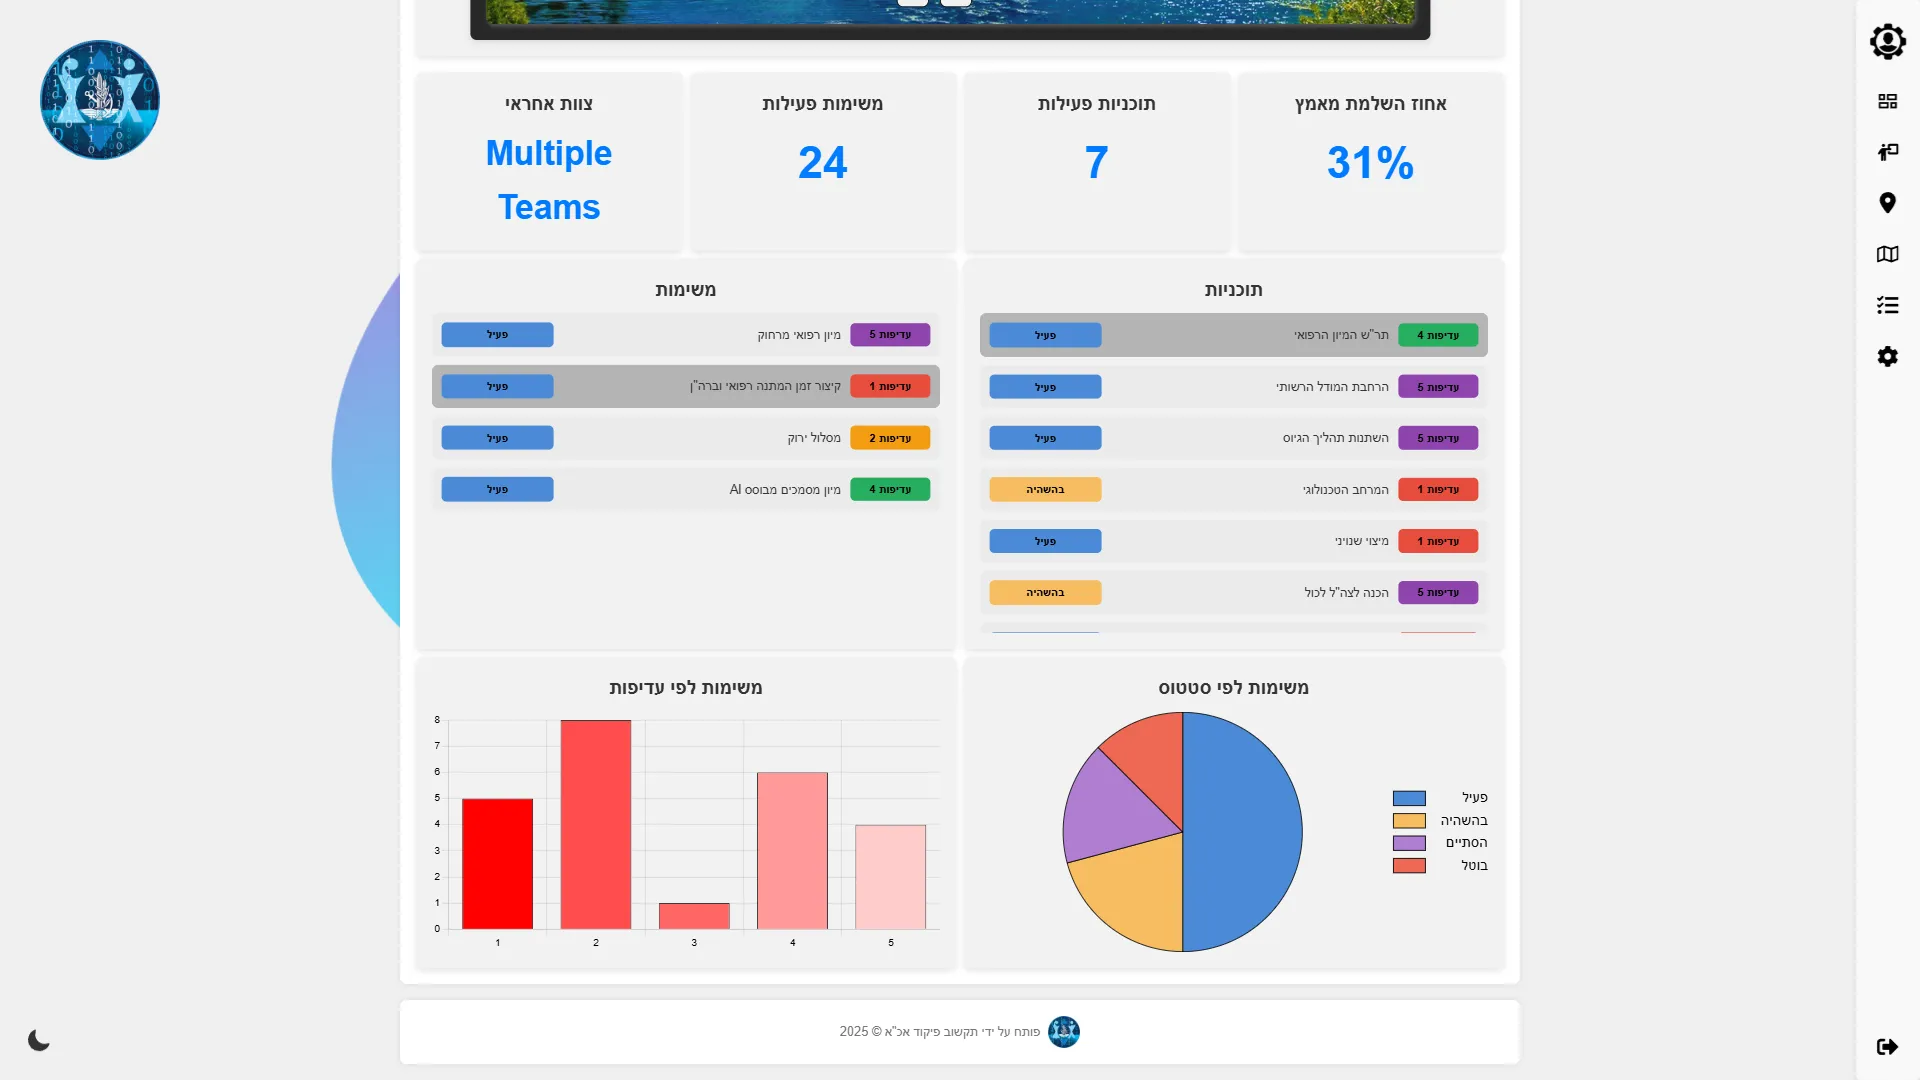
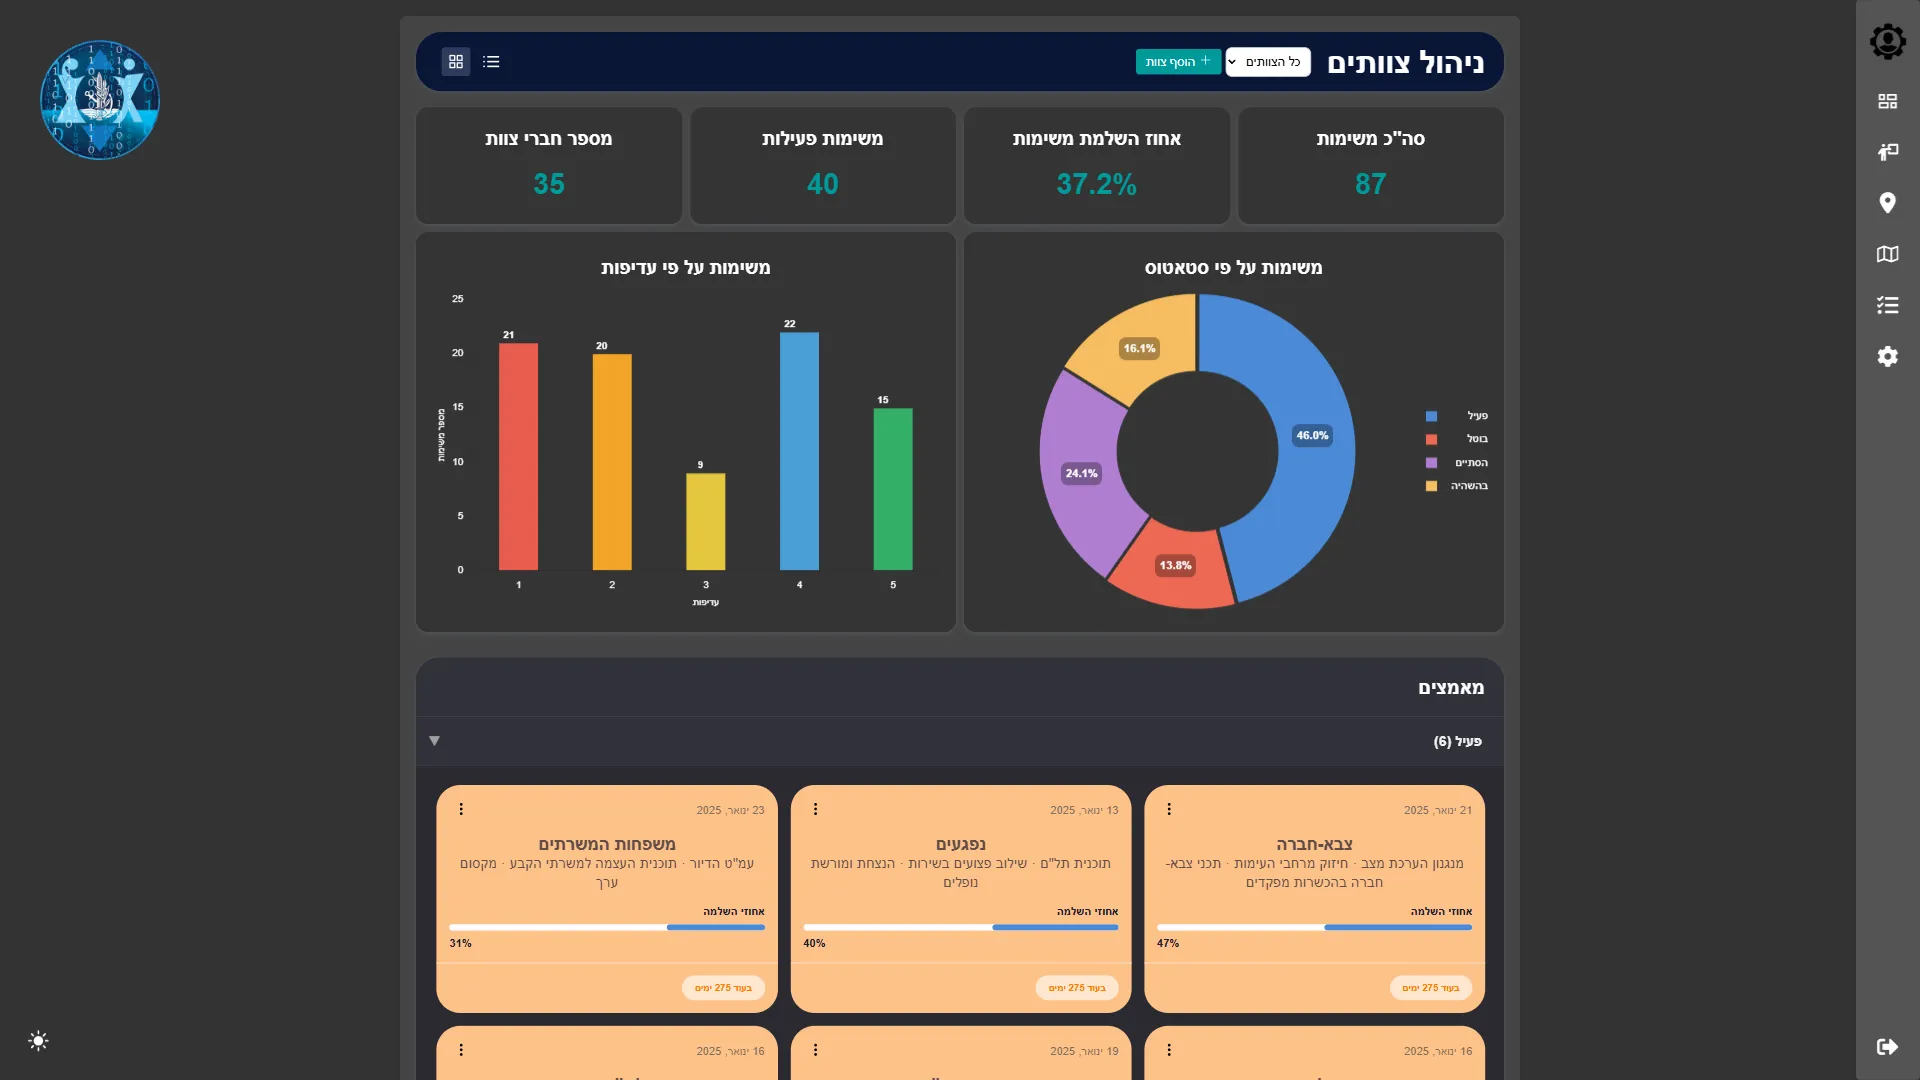
A team-manager dashboard shows the whole picture or one team's view, with headline numbers, charts and colour-coded cards that count down the days to each deadline. A presentation mode turns the same data into slides for the event, one per initiative, and each initiative opens its own dashboard.
How it came together
- Feb 2025First versionProgress tracked by unit: each unit's checkpoints and tasks, a units dashboard and searchable tables.
- Mar 2025Data model rebuilt around teamsInitiatives contain plans, plans contain tasks, and every item can belong to several teams, each with its own progress.
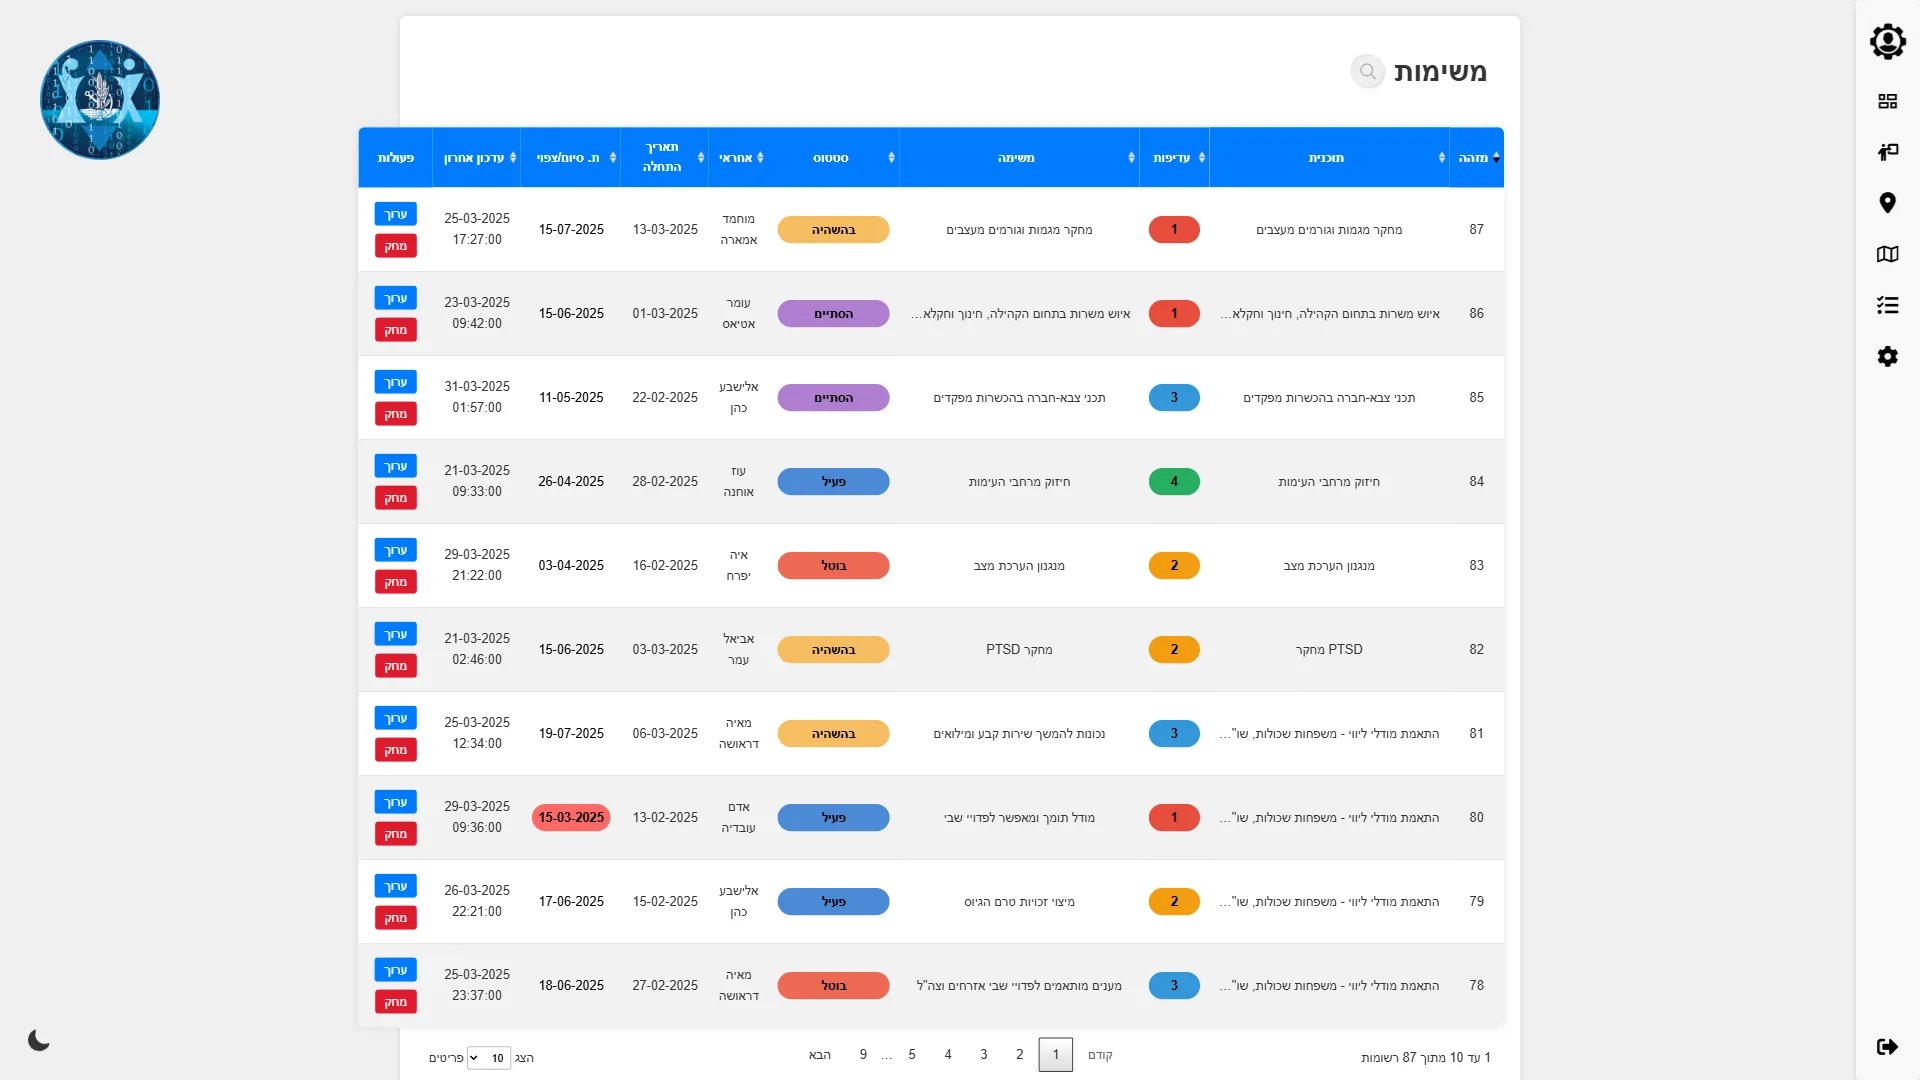
- Mar 2025Dashboard and presentation modeVersion 0.2 added both, along with searchable tables for teams, initiatives, plans and tasks.
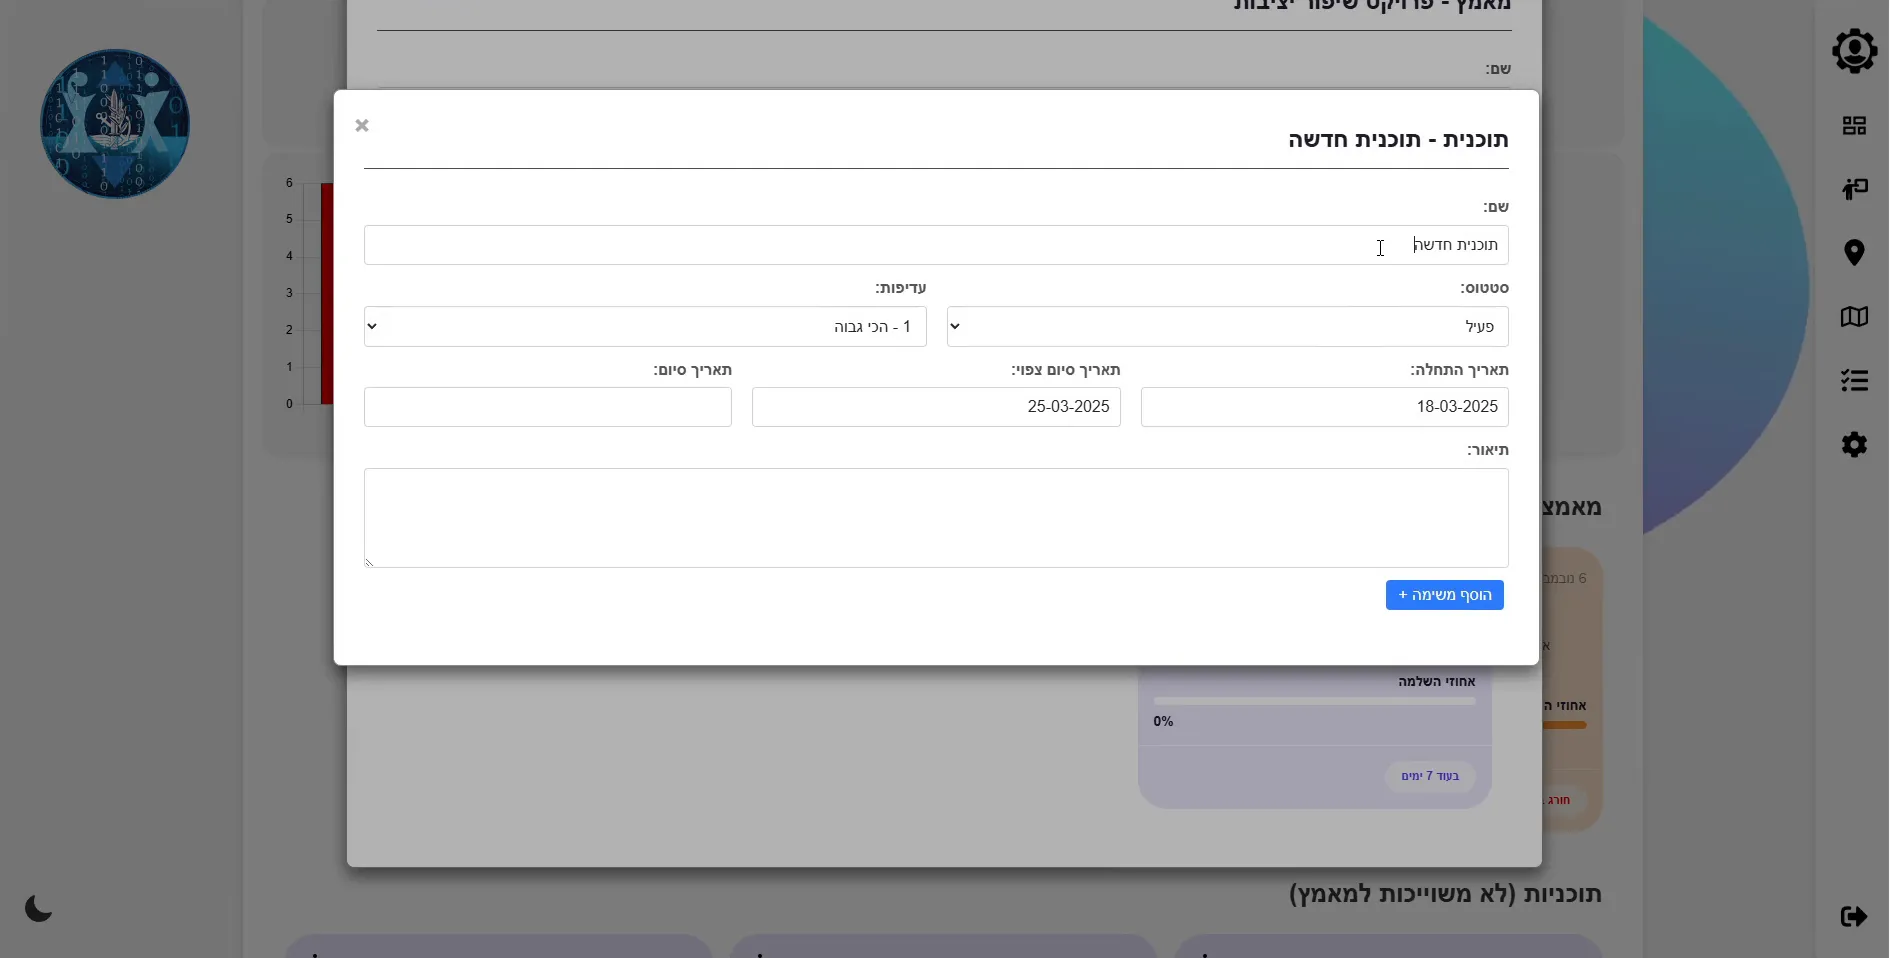
- Mar 2025Nested pop-ups and team linksVersion 0.3 added a menu on every card, team links that reach child items, and role changes.
- Mar 2025Reading plans from spreadsheetsA tool that turns a full plan in a spreadsheet (initiatives, plans, tasks and goals) into the app's structure.
03 / Highlights
Team-manager dashboard
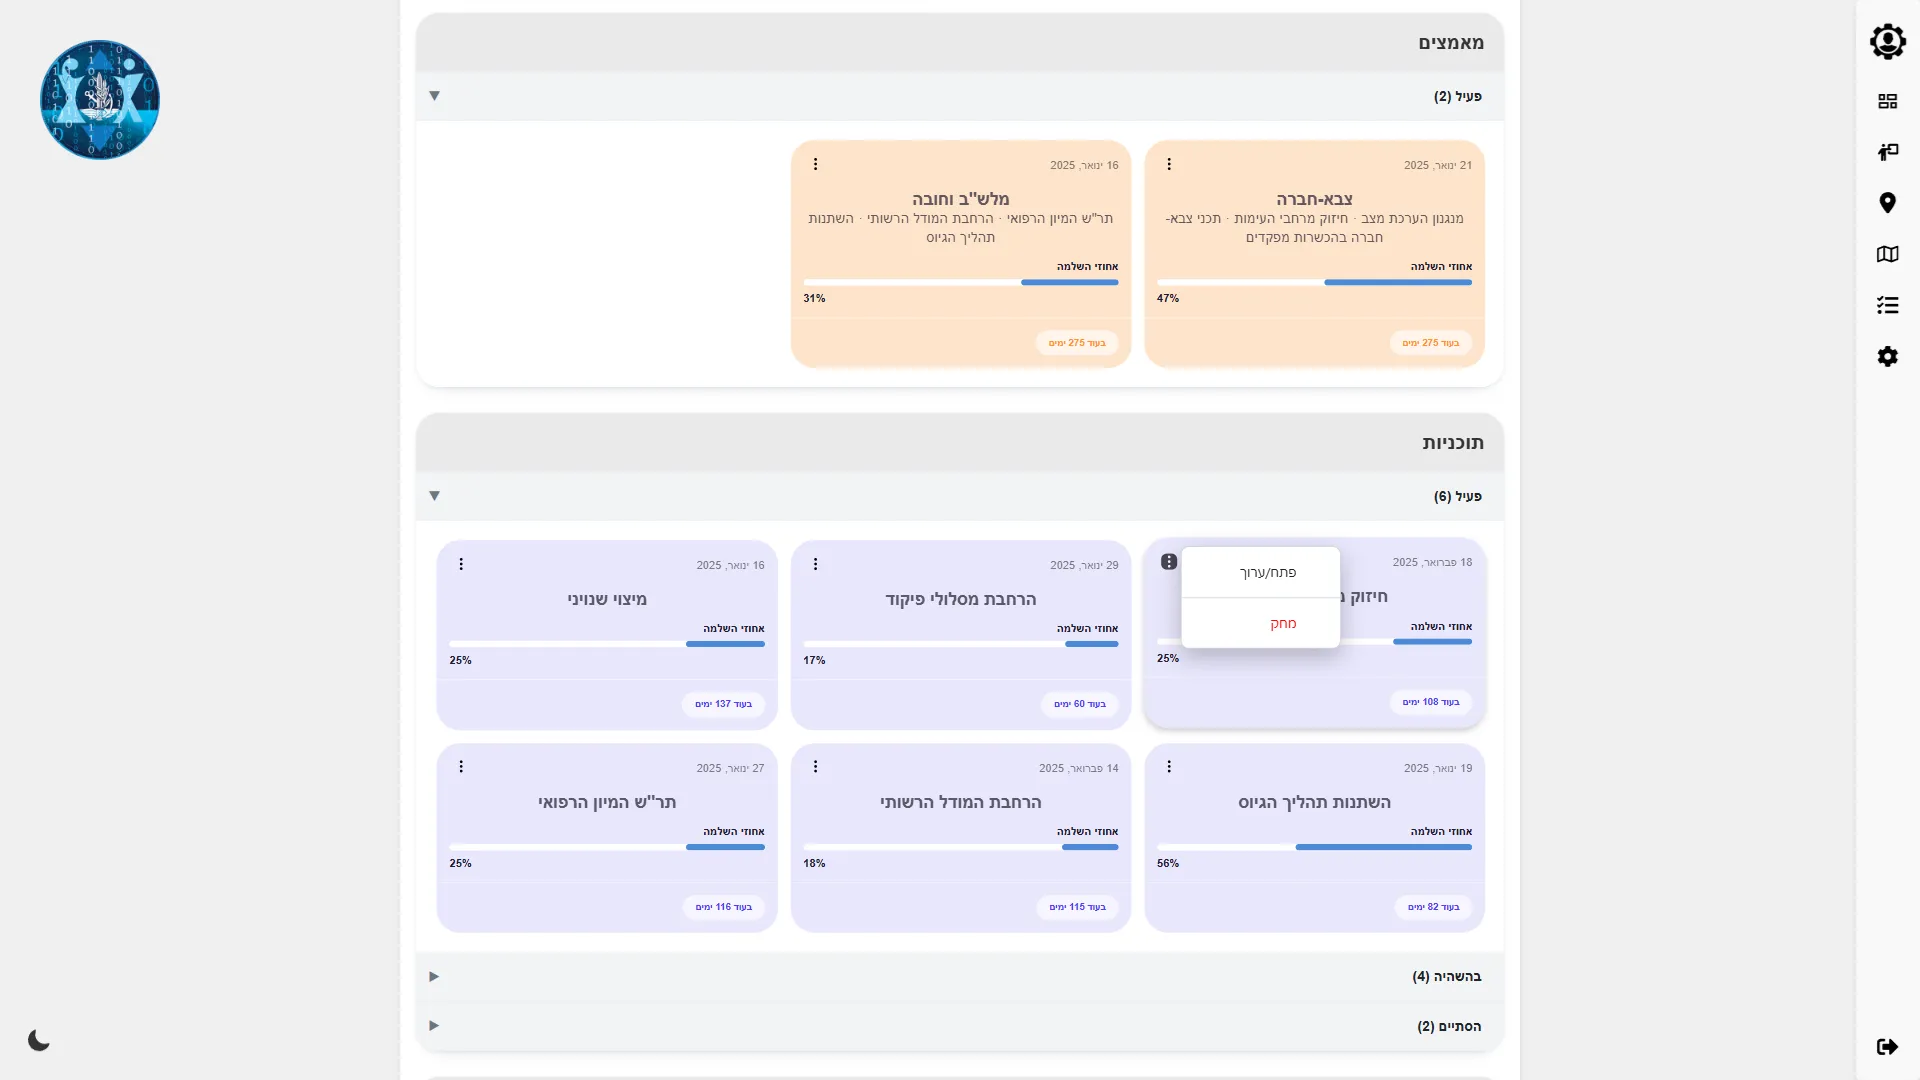
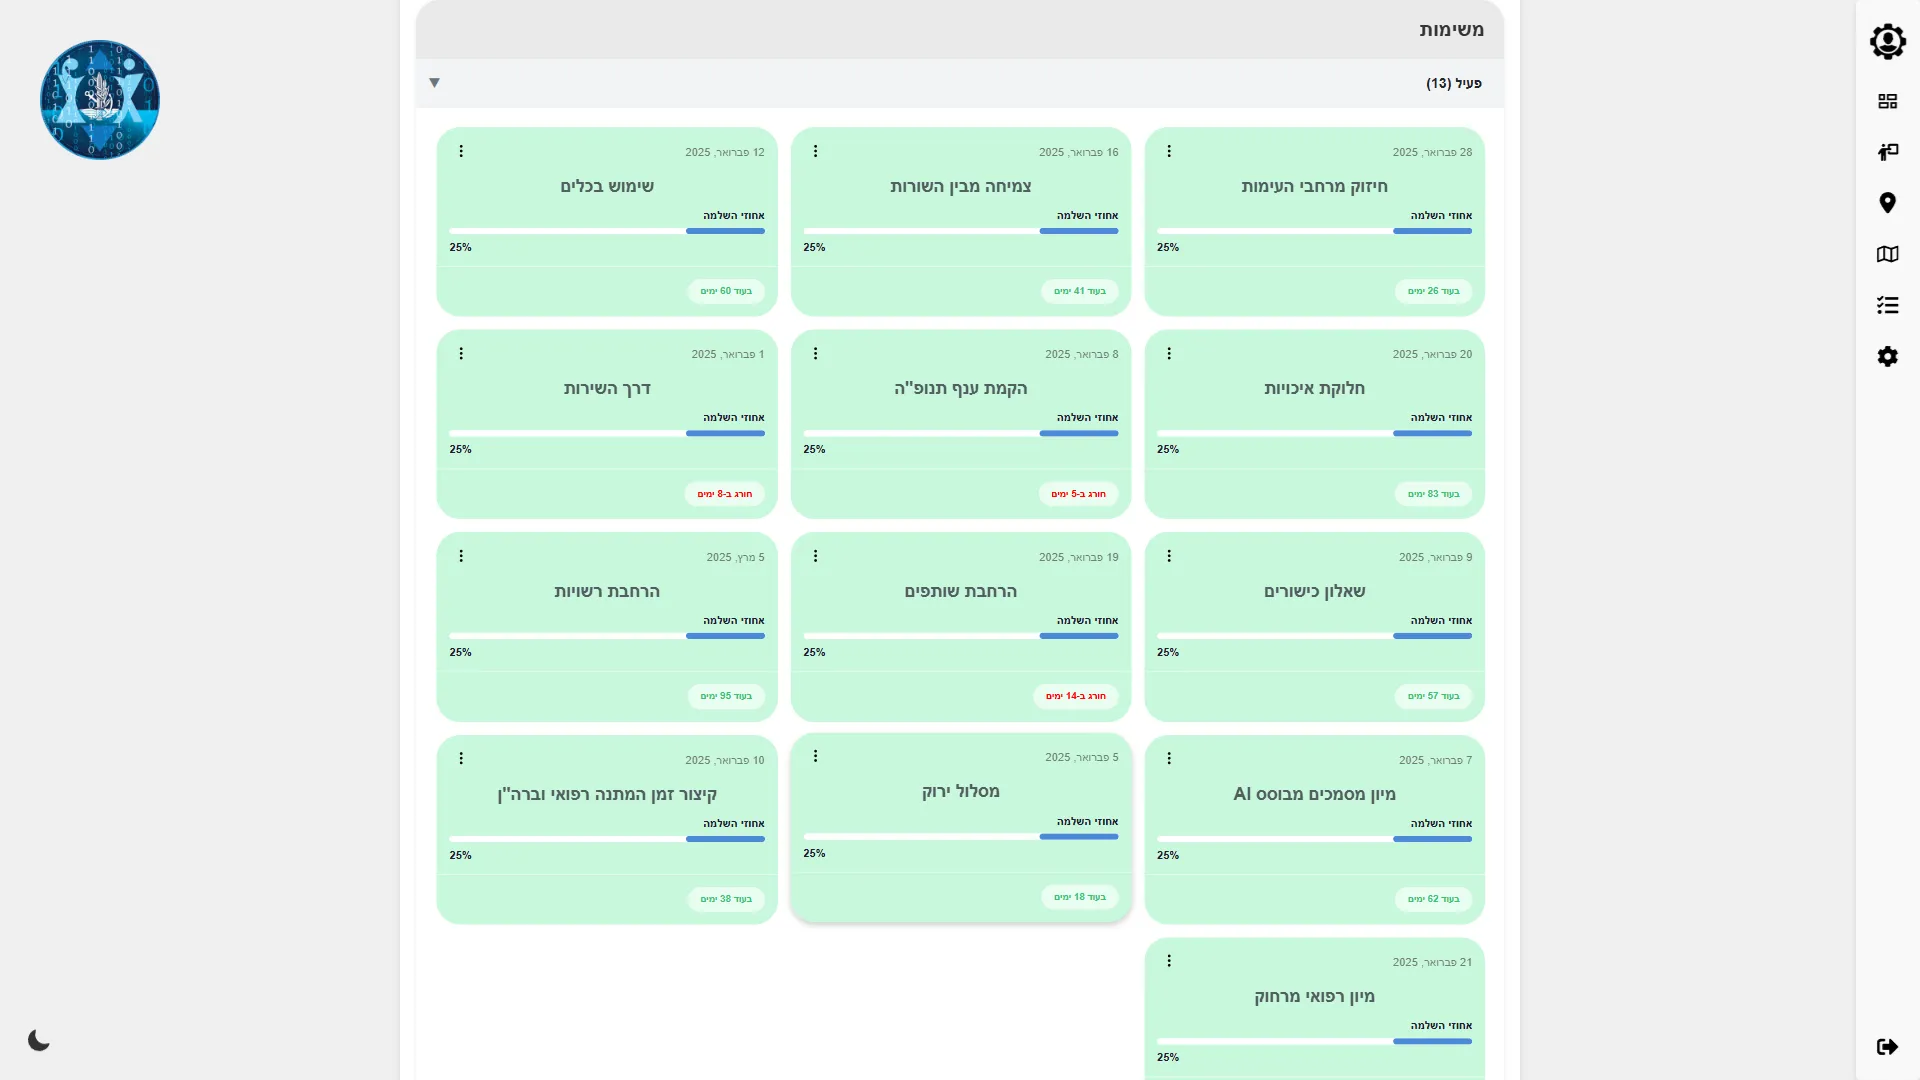
Headline numbers, tasks by priority and by status, and a card for every initiative, plan and task, for all teams or just one.
Initiatives, plans, tasks, teams
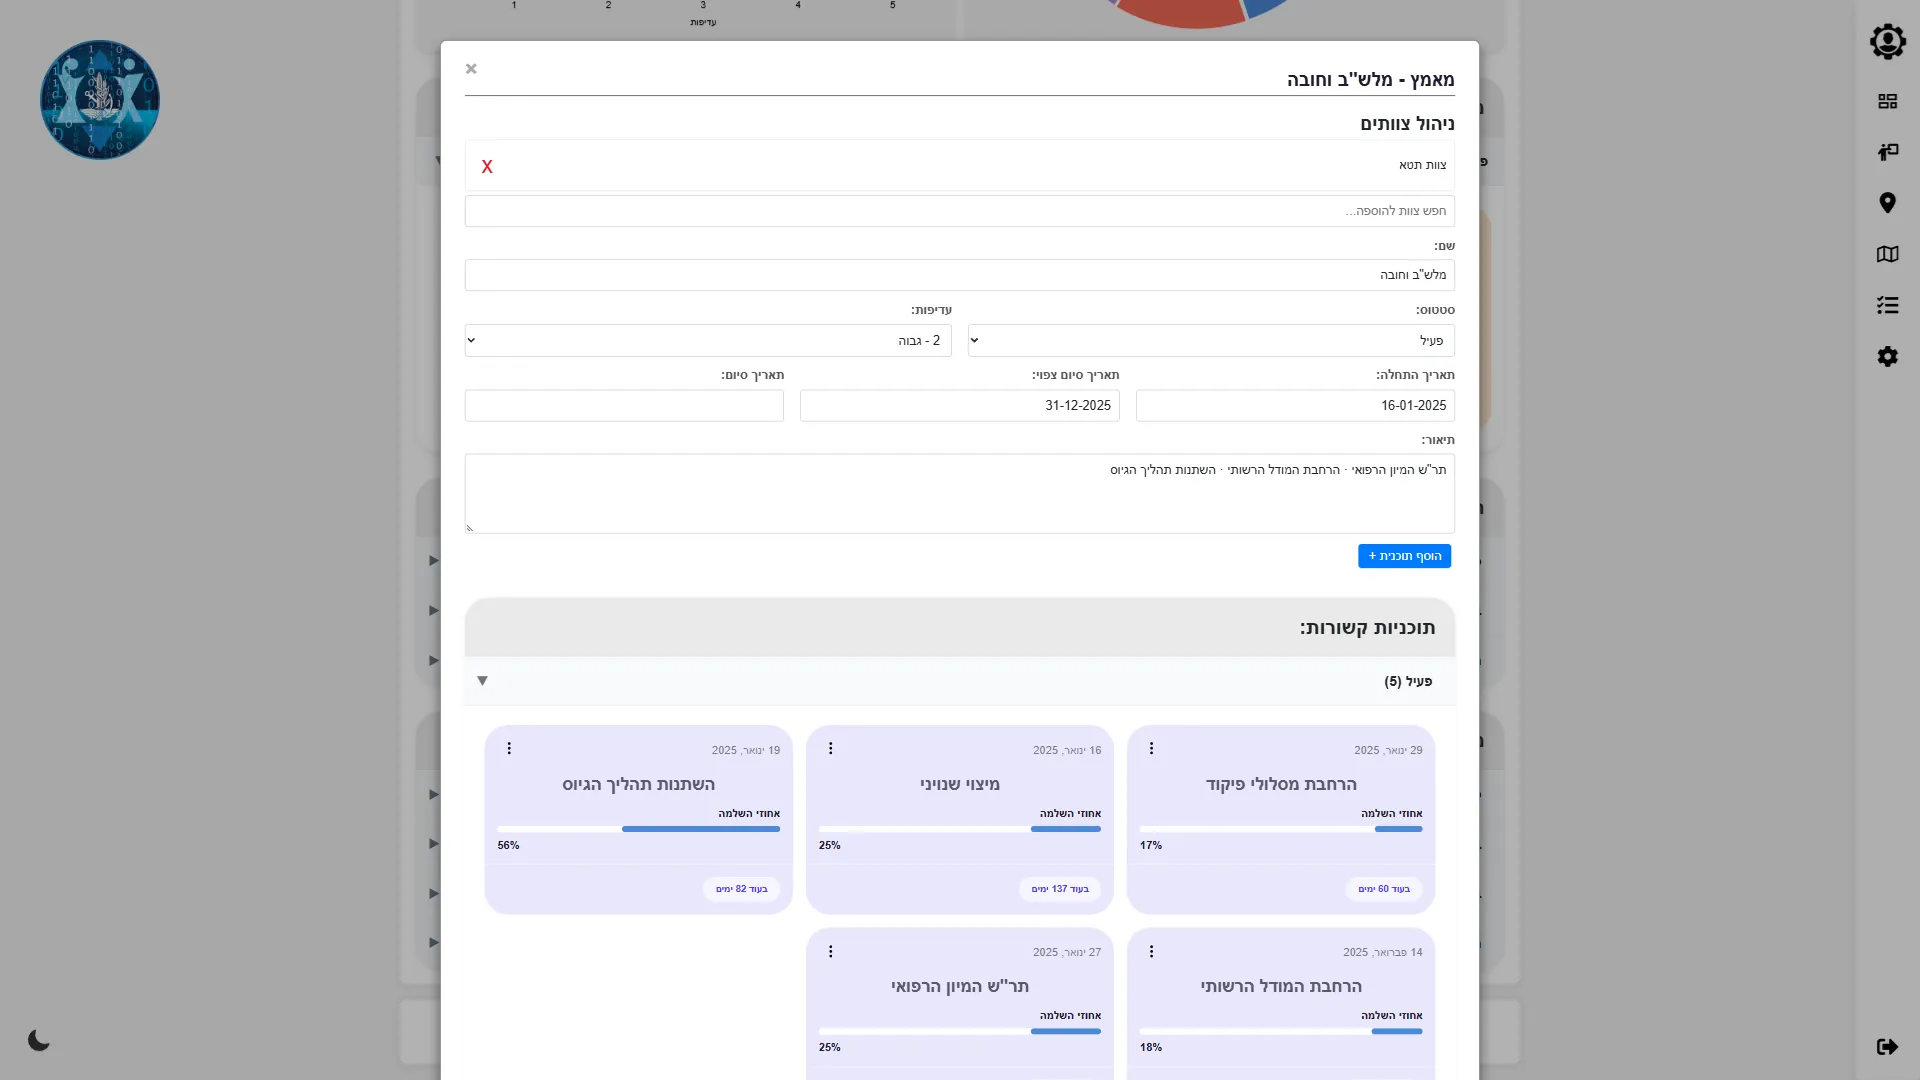
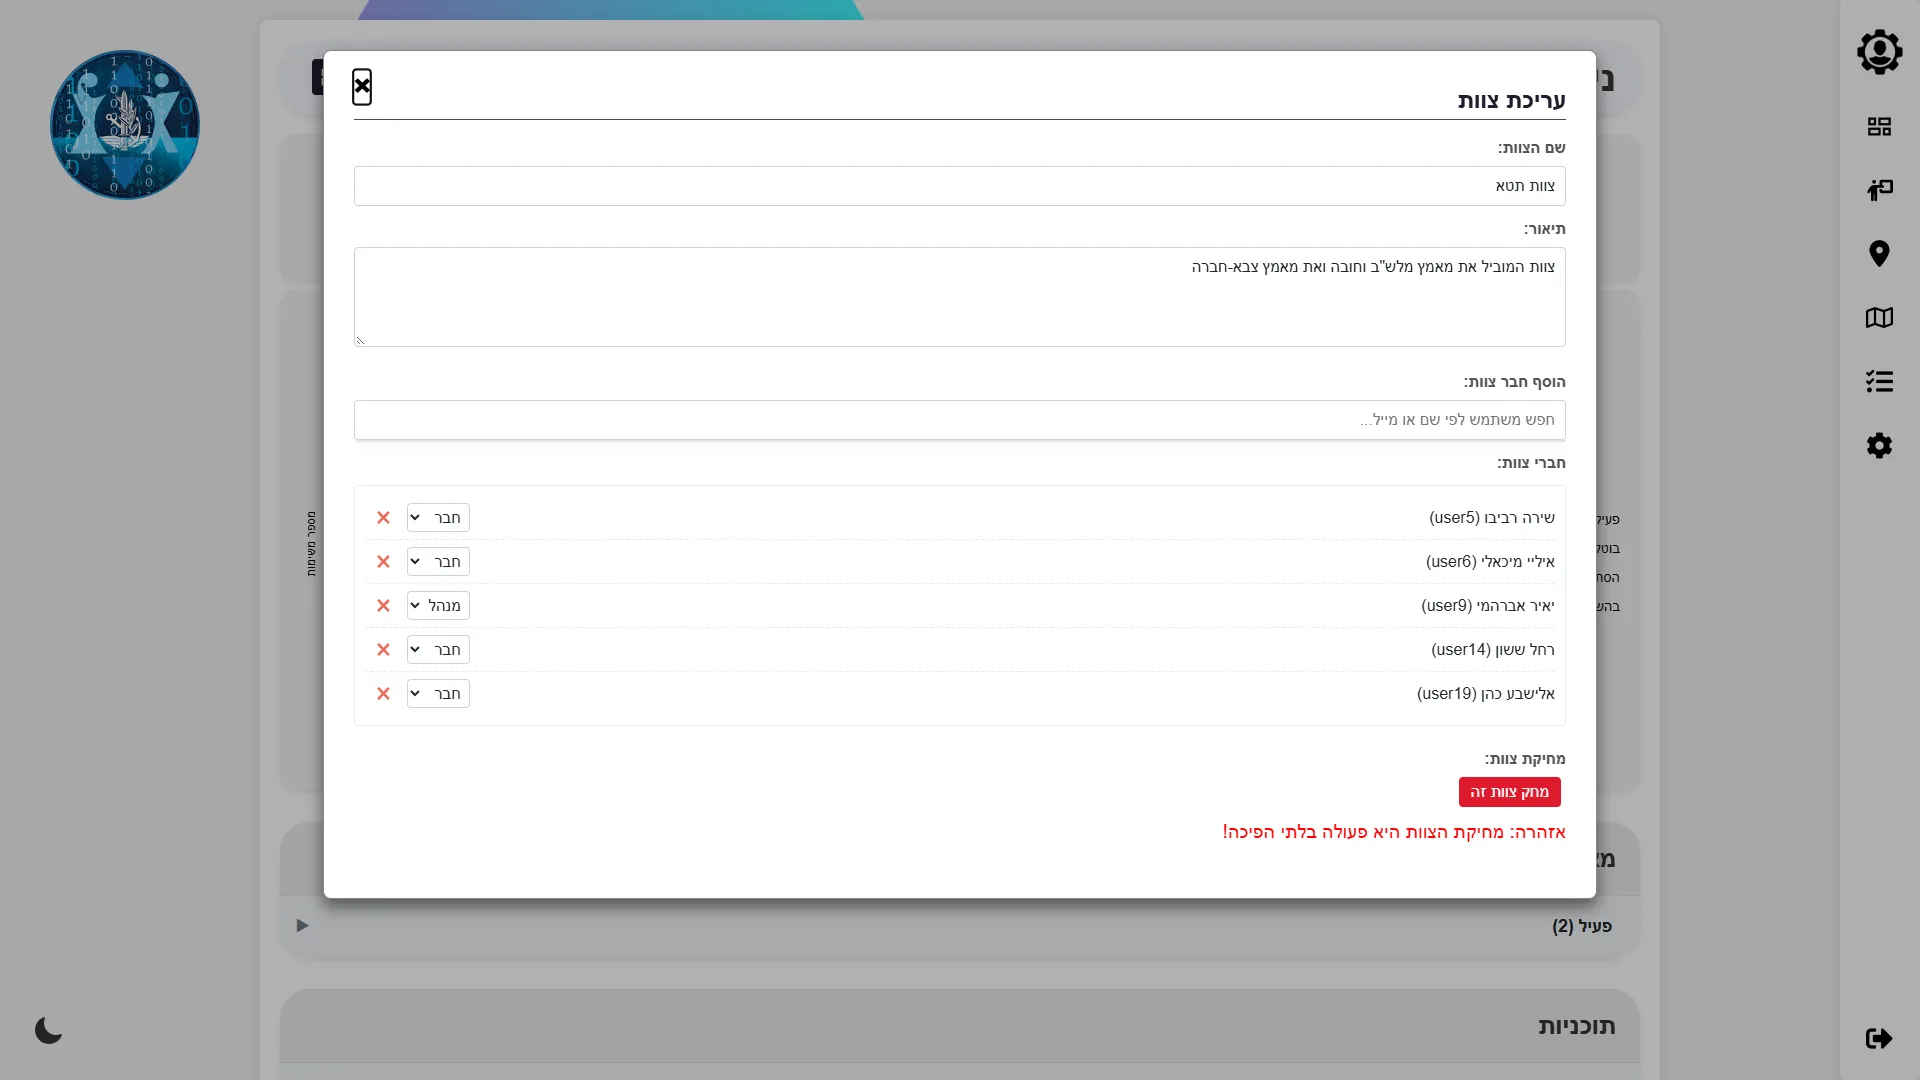
A three-level plan where any item can belong to several teams. Adding a team to an item can apply to everything beneath it.
Tasks tied to goals
Each task records the measurable goal it serves, so day-to-day work stays connected to the goals of the head of AKA.
Deadlines stand out
Every card counts down the days left. Anything past its due date gets a red 'overdue by N days' badge.
Presentation mode for the event
Slides that open with the event's title, then one per initiative. 'Show more' opens that initiative's dashboard, plans and tasks.
Teams, roles and access
Administrators see every team and members see their own teams' work. A team's manager adds members and sets each one's role.
04 / Screens
12 screens · sample data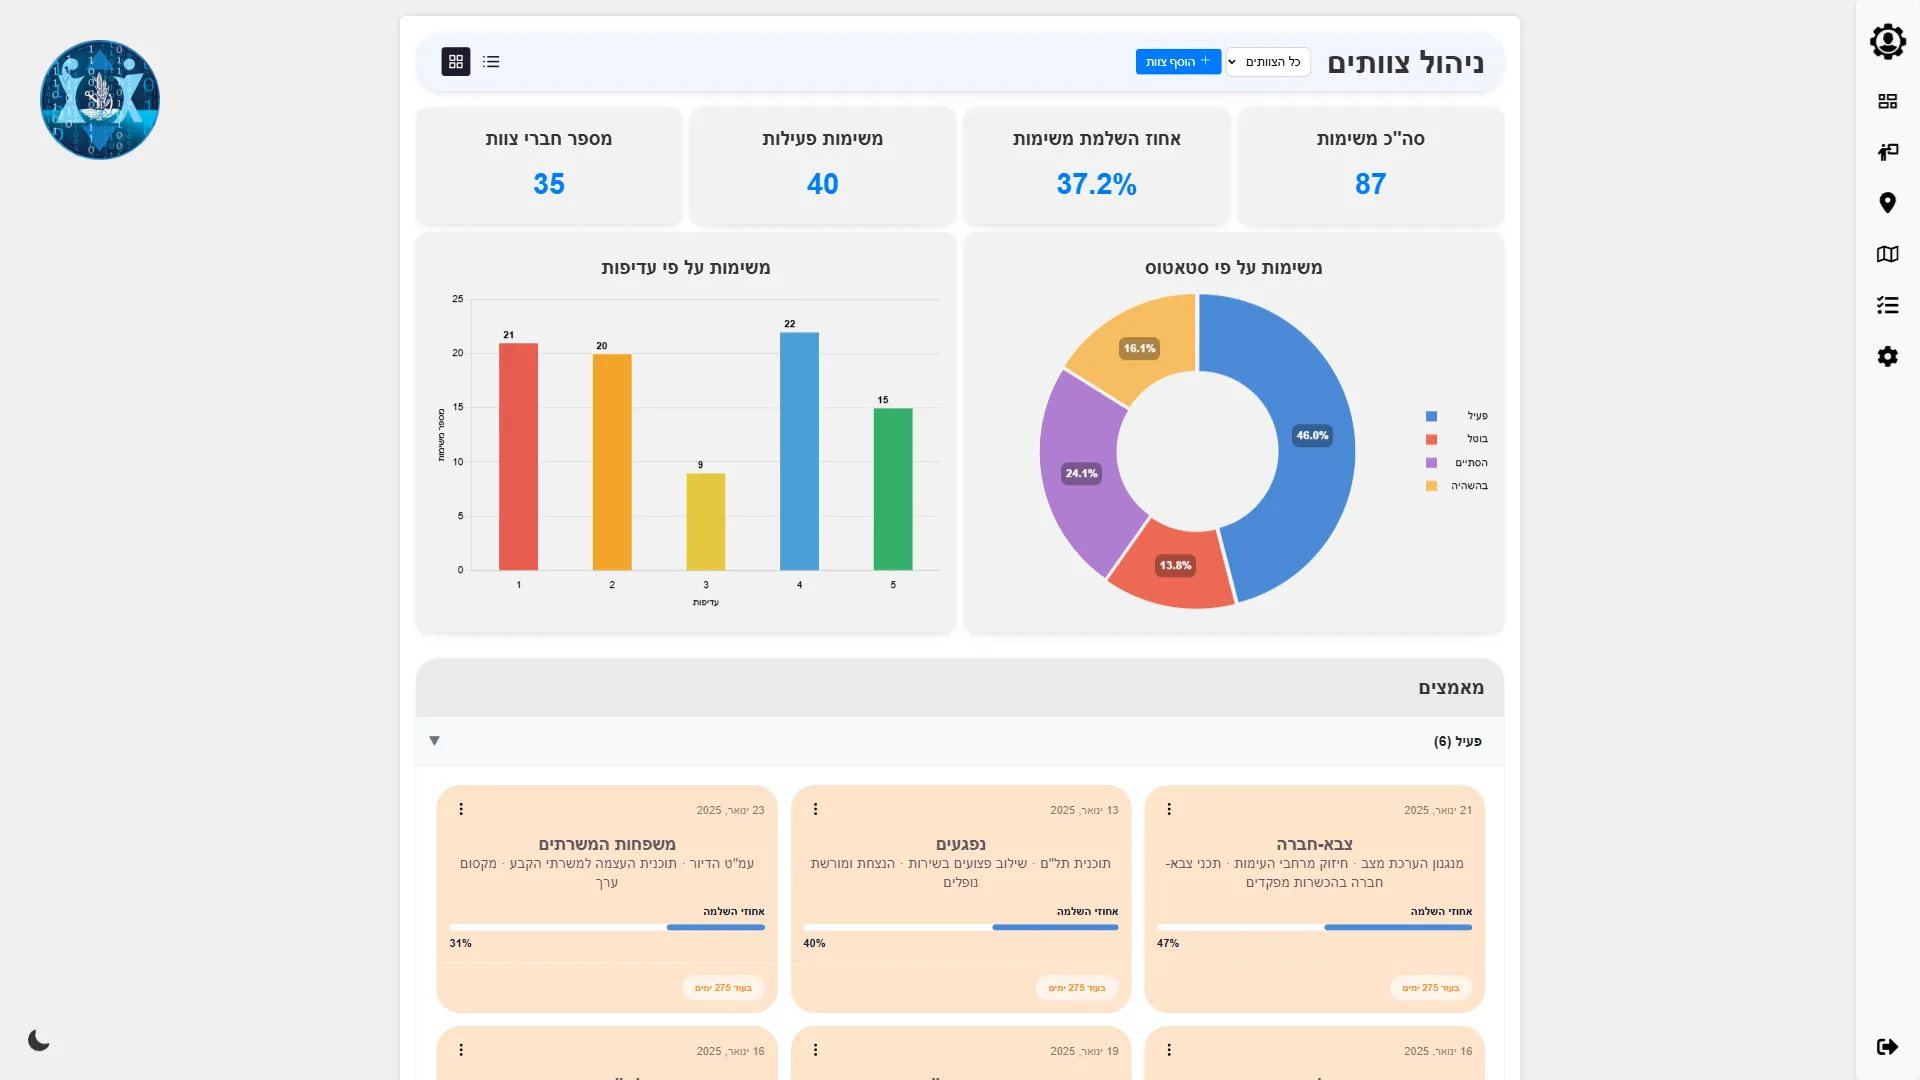
05 / Impact
T100 gives the work toward the goals of the head of AKA one shared home: every initiative, plan and task in one place, linked to the teams responsible, with completion worked out automatically and a presentation ready for the event.
It also shows how quickly I turn a need into working software, and how I rework the foundations when the need changes: between the first and second versions I rebuilt the whole data model around teams.
06 / Role and tech
I built T100 on my own, end to end. I designed the data model, wrote the server, built every screen by hand in JavaScript (cards, nested pop-ups, charts and the presentation slides) and prepared an installation package for computers without internet access.
I shipped three versions in seven weeks. After the first version I rebuilt the data model around teams, then added the presentation mode the event needed.
I worked with ChatGPT and Gemini as coding assistants. To make them useful on a real codebase, I wrote a small tool that packs the project's file tree and code into one briefing, so every new conversation started with the whole project in view. I designed the system, directed the work and decided what went into the code.
Tech
- Python
- Flask
- SQLAlchemy
- SQLite
- Flask-Login
- Authlib (OpenID Connect)
- JavaScript
- jQuery
- Chart.js
- DataTables
- ChatGPT
- Gemini
- Cheroot
- Flask-WTF
- Flatpickr
- Moment.js
How it's built
T100 is a Python Flask web app with a SQLite database, built on my own reusable Flask starter. The server sends JSON to the dashboards, and the screens are hand-written JavaScript with Chart.js charts and DataTables tables, all in Hebrew right-to-left with a light and a dark theme. Sign-in supports local accounts and single sign-on (OpenID Connect), and a packaging script prepares an offline install.
T100 shows how I turn an organisation's goals into a working tool, fast.
A clear data model, at-a-glance screens and a presentation ready for the event.